CASE88 · Buildings · Integrated cooling / Weather-adaptive guide
Coordinating cooling start and water/air setpoints with forecast weather
A commercial-building model recommends precooling start, chilled-water, supply-air and condenser-water temperatures together. Historical-weather energy differences are kept distinct from measured plant savings.
01 · CASE ANALYSIS
Treat cooling as one operating strategy
The guide uses hourly outdoor temperature and relative humidity to calculate enthalpy and a cooling-demand index. It recommends precooling start, CHWST, AHU supply-air temperature and tower leaving-water temperature.
The modeled occupied-start target is 08:30. Chillers, AHUs, towers and condenser-water pumps interact, so individual setpoints should not be optimized in isolation.
02 · CASE ANALYSIS
Retain the historical-weather results
The model reads 8,760 hourly Seoul weather observations for 2023. Across 153 summer days, average optimal precooling was 0.95 h/day and mean recommended chilled-water supply temperature was 8.80°C.
Source electricity totals were 531,289 kWh for the existing strategy and 489,695 kWh for the proposed strategy, a difference of 41,594 kWh or 7.83%.
| Item | Value |
|---|---|
| Weather observations | 8,760 hours; 2023 Seoul |
| Summer days | 153 |
| Mean precooling | 0.95 h/day |
| Mean recommended CHWST | 8.80°C |
| Existing / proposed modeled electricity | 531,289 / 489,695 kWh |
| Modeled difference | 41,594 kWh; 7.83% |
03 · CASE ANALYSIS
State the incomplete energy boundary
Those electricity totals are model calculations, not metered site data. Some precooling-period consumption and auxiliary electricity are not fully included.
The difference therefore cannot be stated as complete net plant savings or verified energy reduction. It is source-model potential under its assumptions.
04 · CASE ANALYSIS
Calibrate and measure the integrated plant
Calibrate weather/setpoint rules against indoor service, operating hours, chiller part-load performance and actual plant measurements. Confirm humidity and rack/zone thermal requirements where applicable.
Include all start-period and occupied-period energy, pump/fan/tower responses and weather/load adjustments in field M&V. Verified saving is adjusted-baseline energy minus actual energy at the same boundary.
| Output / boundary | Required check |
|---|---|
| Precooling start | 08:30 indoor target and full start-period energy |
| CHW / supply-air temperatures | Cooling service and part-load performance |
| Condenser-water temperature | Chiller plus tower/pump response |
| M&V energy boundary | All included equipment; adjusted baseline and actual |
Source-value comparison
Source figures · English edition
Figures correspond to those published in the Korean case. English titles, axes and legends are provided; published values and evidence boundaries are retained. Open a figure at full size to inspect small labels.
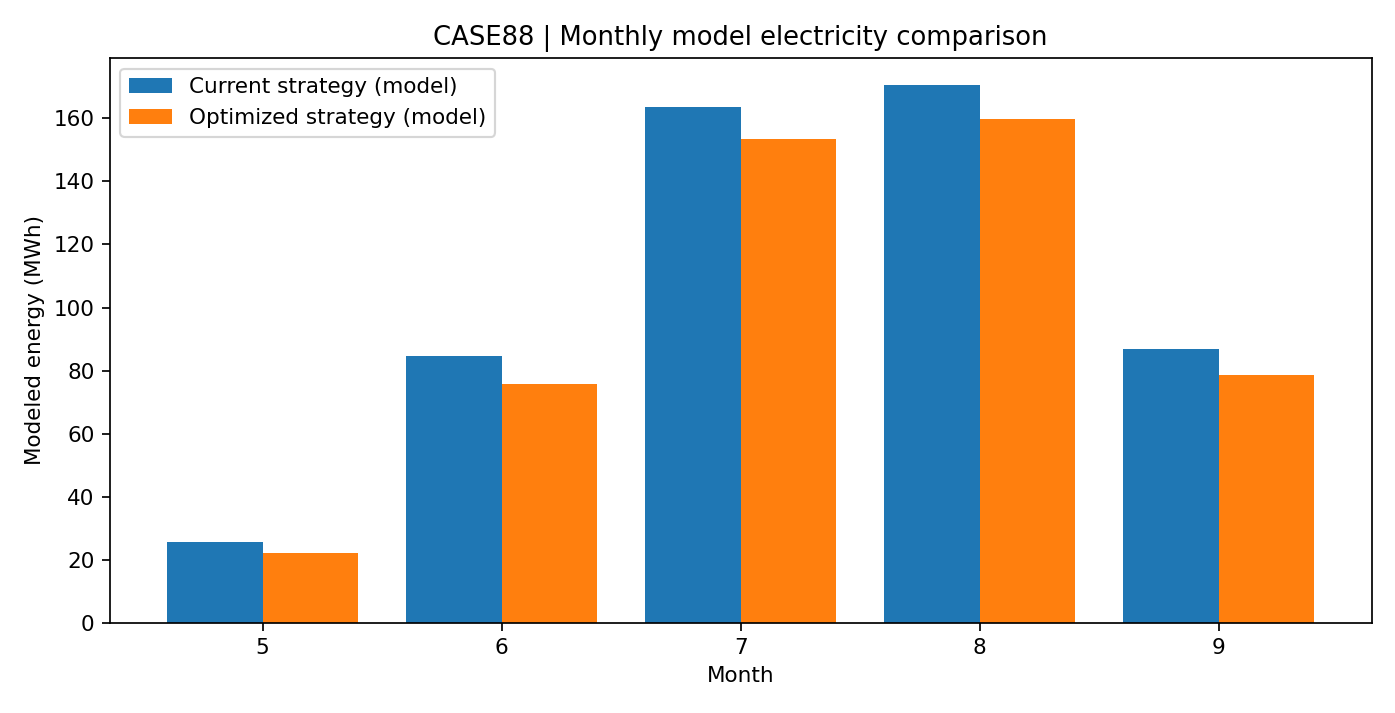
Original already-English monthly electricity-model comparison. The CASE88 model incompletely represents some precooling and auxiliary electricity; do not claim complete net savings.
Open full-size figure ↗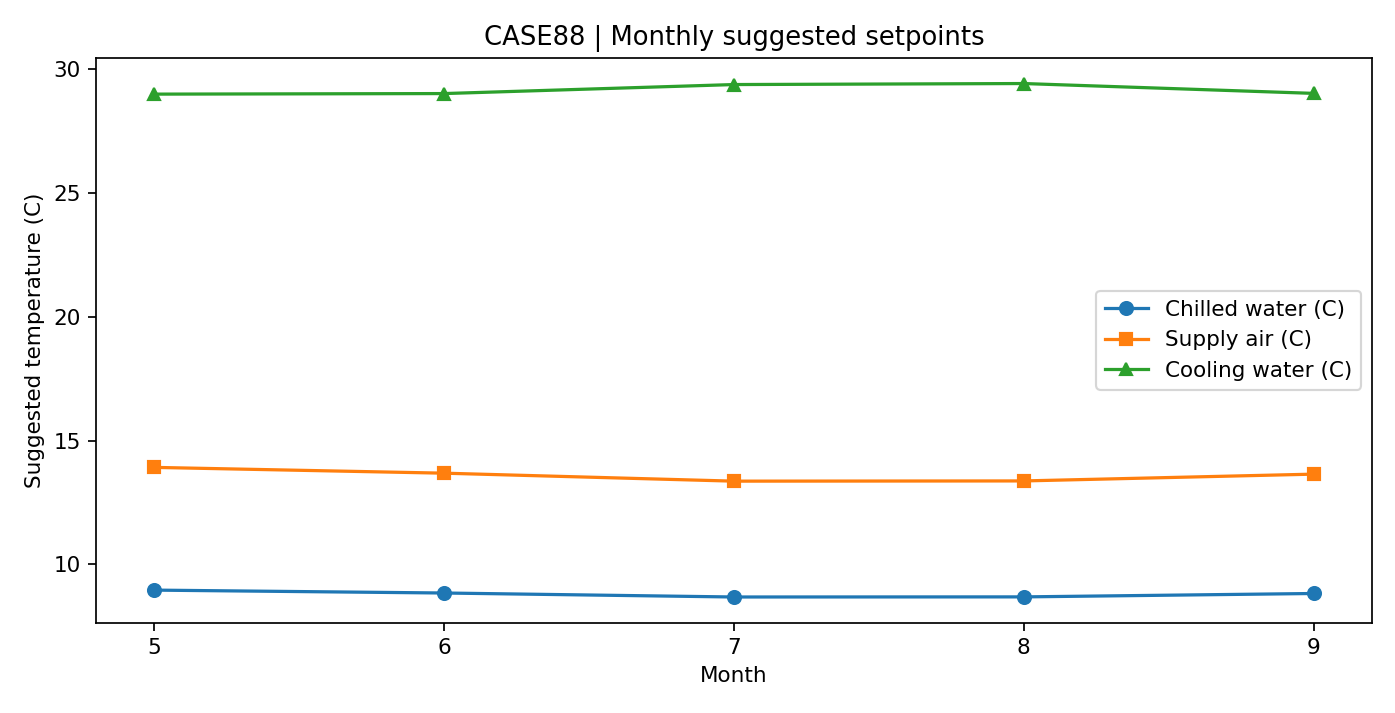
Original already-English monthly suggested chilled-water, supply-air and condenser-water temperatures. Model recommendations require building-specific calibration.
Open full-size figure ↗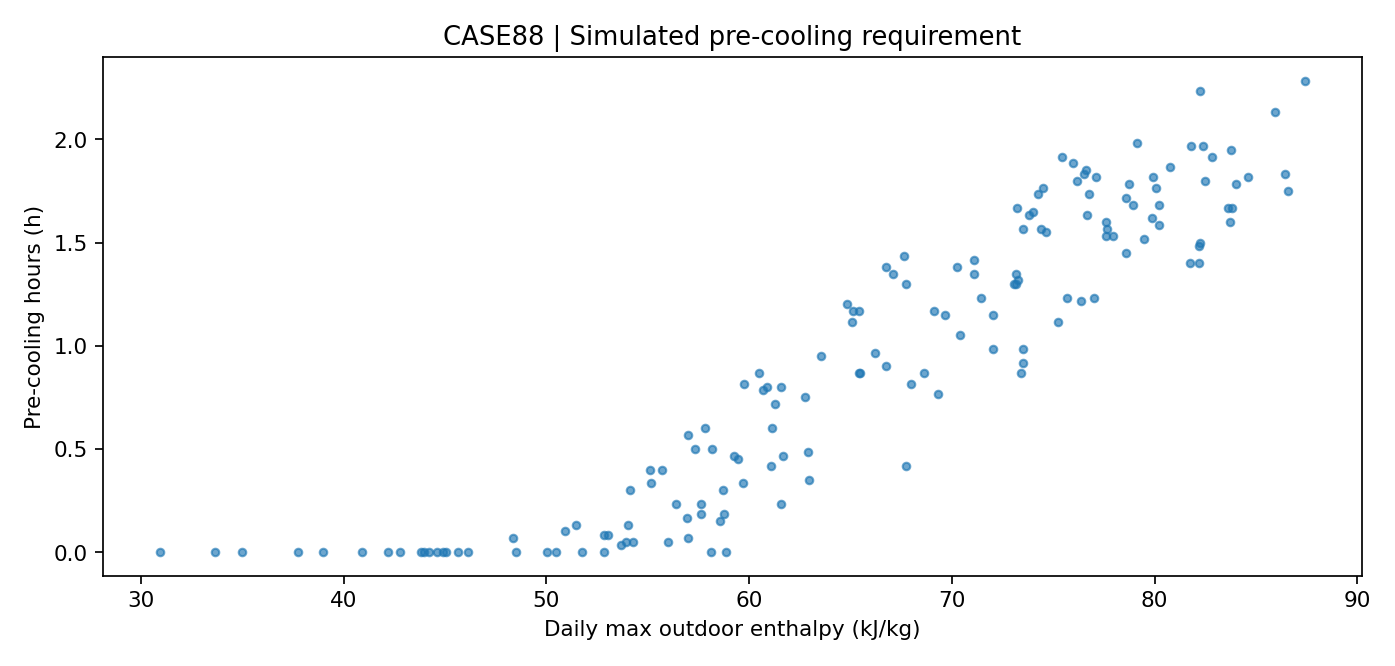
Original already-English precooling scatter. Its data marks are preserved and remain historical simulation outputs.
Open full-size figure ↗APPLY TO YOUR SITE
Connect your operating data to an actionable energy strategy.
Discuss the measurement boundary, data quality, operating constraints and verification approach for your facility.
Discuss your project All English cases