CASE86 · Buildings · HVAC / Optimal Start
Finding the latest feasible HVAC start from weather and building response
A minute-step thermal model searches for the latest heating or cooling start that meets the 08:30 indoor-temperature target. Historical-weather results describe recommended pre-start hours.
01 · CASE ANALYSIS
Define the service target
The source model aims for 22°C in winter and 24°C in summer at 08:30. Winter uses outdoor temperature; summer includes temperature and humidity through outdoor-air enthalpy.
The objective is the latest feasible start, not the earliest possible start. Enough pre-operation must remain to meet the modeled occupied-start condition.
02 · CASE ANALYSIS
Reproduce the model assumptions
Initial indoor conditions are estimated from midnight weather and day type. Minute-step calculations combine thermal loss/gain with HVAC temperature response.
Source parameters include heating rate 3.5°C/h and loss rate 0.07, and cooling rate 4.8°C/h with gain coefficient 1.0. These are model inputs, not universal building constants.
| Item | Heating | Cooling |
|---|---|---|
| Indoor target | 22°C | 24°C |
| Target time | 08:30 | 08:30 |
| Weather driver | Outdoor temperature | Outdoor enthalpy |
| Response rate | 3.5°C/h | 4.8°C/h |
| Loss / gain parameter | 0.07 | 1.0 |
03 · CASE ANALYSIS
Read the historical-weather output
For 151 winter days, mean optimal preheating was 3.90 h/day with range 0.18–8.50. For 153 summer days, mean precooling was 0.95 h/day with range 0.00–2.28.
The source does not numerically define the existing site fixed-start baseline. Consequently no start-time reduction percentage or energy-saving rate is inferred here.
04 · CASE ANALYSIS
Calibrate before operational use
Collect outdoor and indoor temperatures, HVAC states and occupied-start service over several weeks. Refit initial conditions and response rates and compare predicted against actual arrival conditions.
For M&V, record all relevant pre-start electricity, gas and heat at the same boundary and compare actual energy with a weather-adjusted fixed-start baseline.
| Item | Winter | Summer |
|---|---|---|
| Days | 151 | 153 |
| Mean pre-start | 3.90 h/day | 0.95 h/day |
| Range | 0.18–8.50 h/day | 0.00–2.28 h/day |
| Existing fixed-start numeric baseline | Not defined | Not defined |
Source figures · English edition
Figures correspond to those published in the Korean case. English titles, axes and legends are provided; published values and evidence boundaries are retained. Open a figure at full size to inspect small labels.
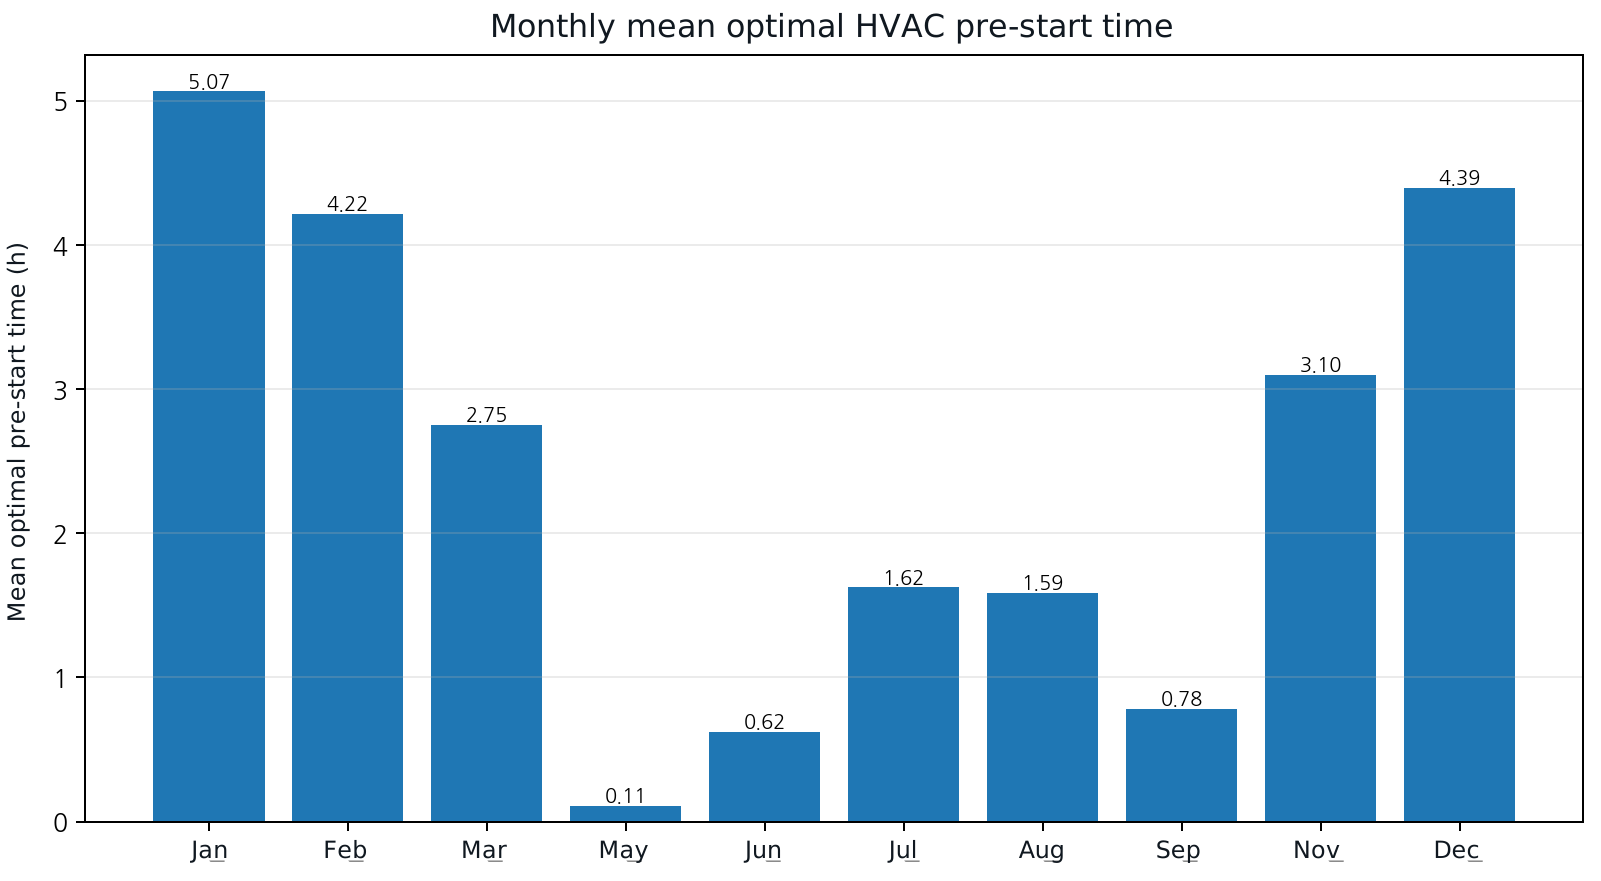
Monthly mean modeled optimal pre-start hours. Winter and summer have different targets and model parameters; absent months are not added.
Open full-size figure ↗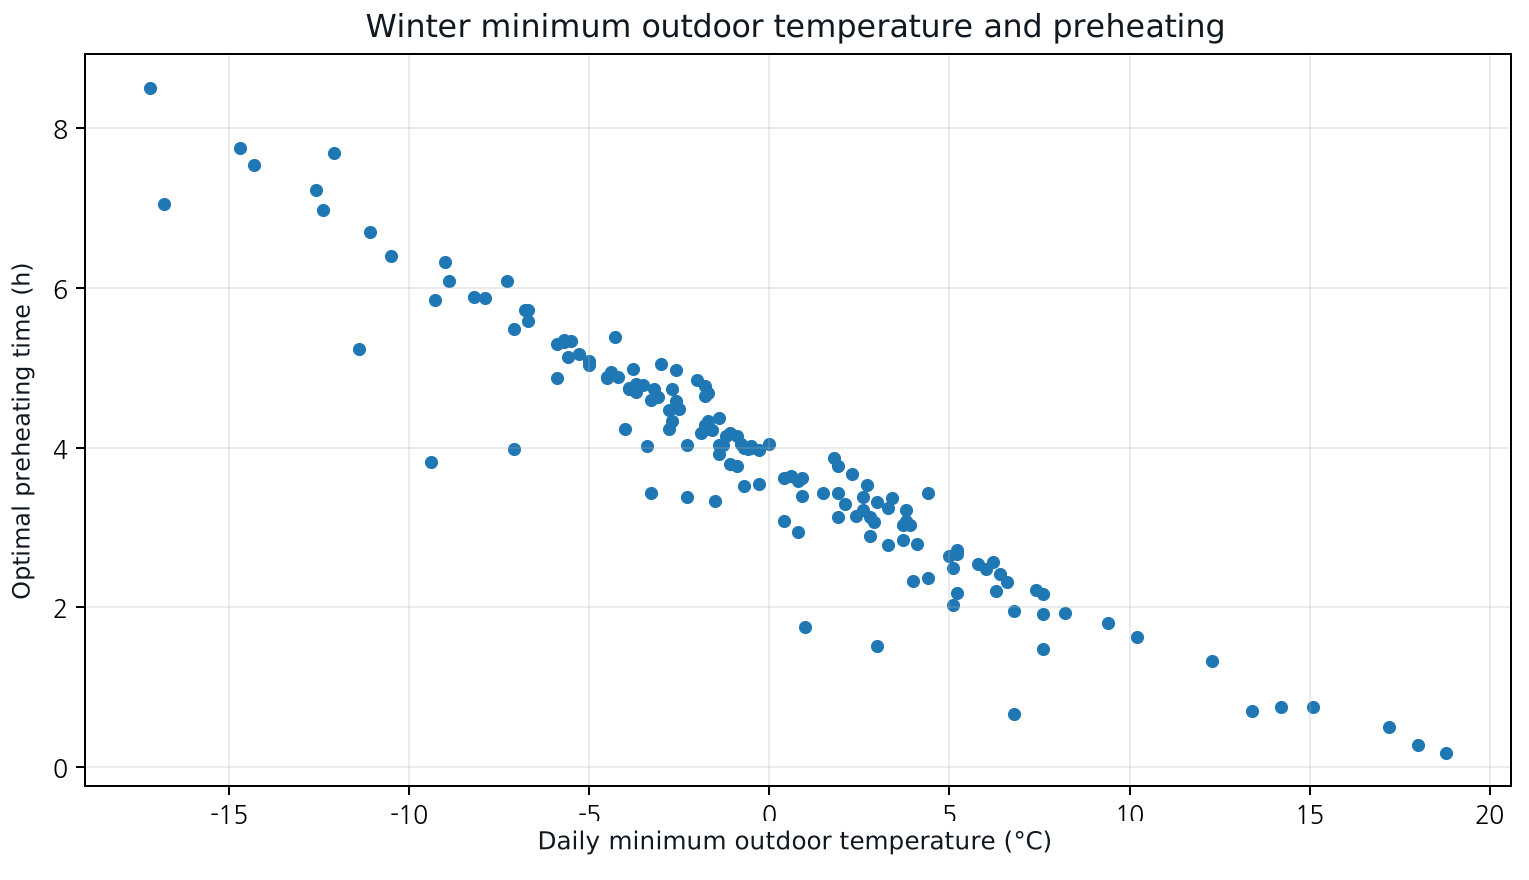
Original winter scatter points: daily minimum outdoor temperature against modeled optimal preheating time. Simulation, not verified energy savings.
Open full-size figure ↗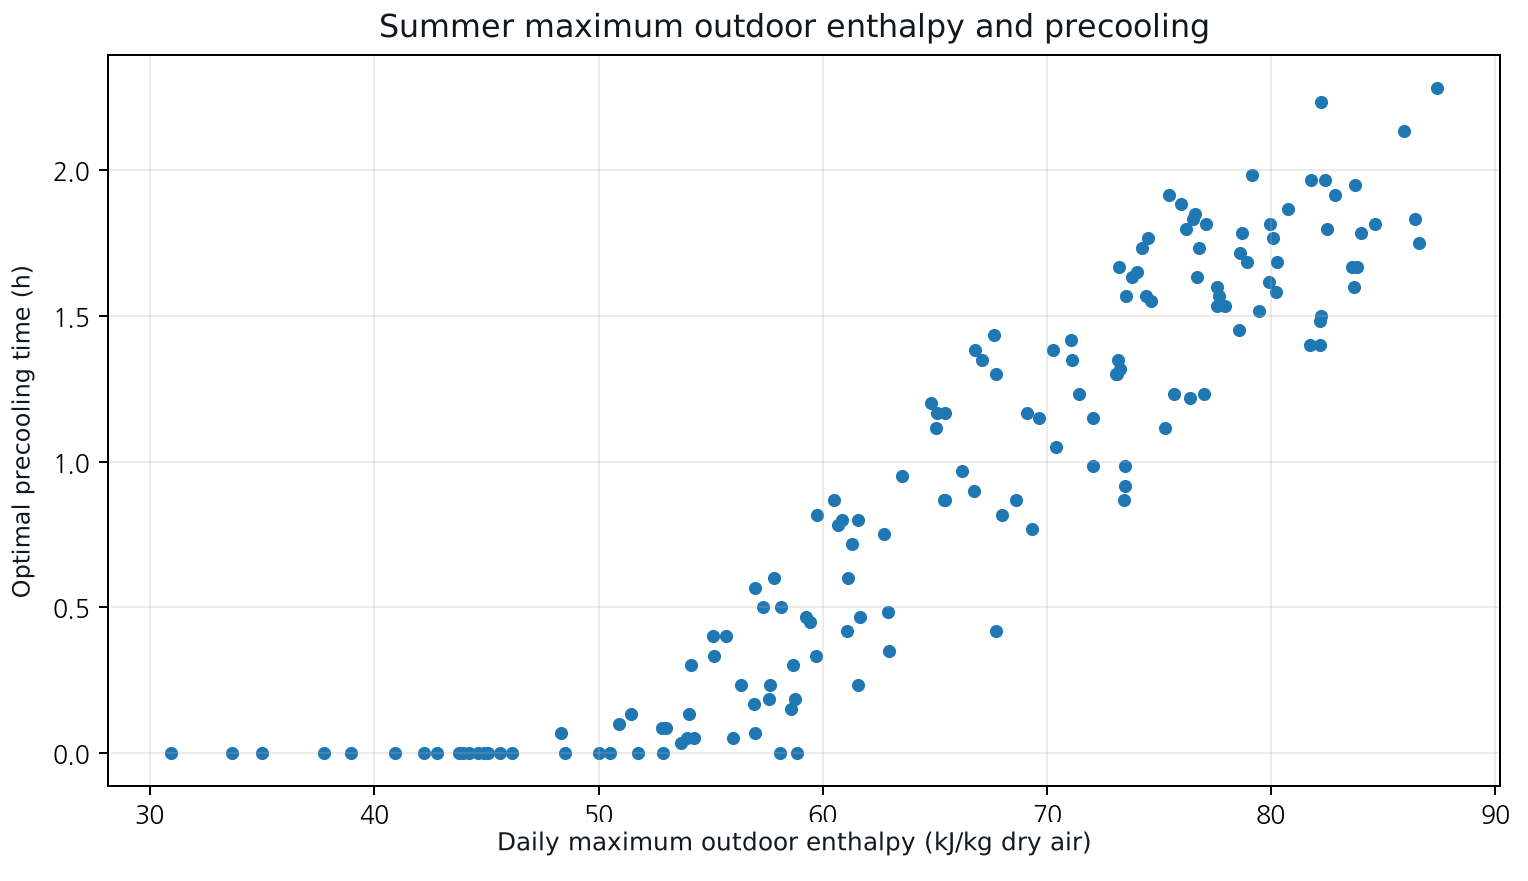
Original summer scatter points: daily maximum outdoor enthalpy against modeled optimal precooling time. Simulation, not verified energy savings.
Open full-size figure ↗APPLY TO YOUR SITE
Connect your operating data to an actionable energy strategy.
Discuss the measurement boundary, data quality, operating constraints and verification approach for your facility.
Discuss your project All English cases