CASE85 · Buildings · Central boiler / HDD schedule
Using heating degree days to guide central-boiler operating hours
A historical-weather model replaces stepped minimum-temperature schedules with an HDD-based daily runtime guide. The result is an operating-hour potential, not a measured fuel saving.
01 · CASE ANALYSIS
Define the model and heating season
The source uses 2023 Daejeon hourly temperatures and January–March plus November–December heating operation. Existing starts were 04:30, 09:00, 16:00 and 21:00.
The source HDD expression is 18 − (daily maximum + daily minimum temperature) / 2. The guide uses this temperature-based demand index to determine total daily boiler hours.
02 · CASE ANALYSIS
Compare the existing and proposed guides
Existing control assigned each of four runs a duration from daily minimum temperature: 0, 0.50, 1.00, 1.50, 1.67 or 1.83 hours.
The proposed guide uses 0 hours below HDD 5, 1 hour from 5 to below 9, and 2 hours from 9 to below 12. At HDD 12 it moves to 4.0 hours, increasing linearly to 7.3 hours at HDD 30 with a 7.3-hour cap.
| HDD range | Total runtime |
|---|---|
| HDD < 5 | 0 h/day |
| 5 ≤ HDD < 9 | 1 h/day |
| 9 ≤ HDD < 12 | 2 h/day |
| HDD ≥ 12 | 4.0 h at HDD 12 → 7.3 h at HDD 30; cap 7.3 h |
03 · CASE ANALYSIS
Interpret the simulated annual result
Reported existing runtime was 843.8 h/year and proposed runtime 528.9 h/year, a difference of 314.9 h/year or 37.32%.
These are simulation results for operating hours. Boiler capacity, part-load efficiency and metered fuel are not provided to justify an identical gas-saving percentage.
04 · CASE ANALYSIS
Calibrate and verify at the site
Allocate total daily hours across the four operating periods and check room temperature, supply/return temperatures, complaints and actual gas. Trial mild conditions before widening the operating range.
Separate space heating from domestic-hot-water demand when meters combine them. Actual fuel savings require a weather-adjusted baseline and measured reporting consumption.
| Month | Existing | Proposed | Source difference |
|---|---|---|---|
| January | 210.7 h | 156.8 h | 53.9 h |
| February | 180.9 h | 125.0 h | 56.0 h |
| March | 138.0 h | 43.4 h | 94.7 h |
| November | 139.5 h | 81.8 h | 57.7 h |
| December | 174.7 h | 122.0 h | 52.7 h |
| Annual | 843.8 h | 528.9 h | 314.9 h |
Source-value comparison
Source figures · English edition
Figures correspond to those published in the Korean case. English titles, axes and legends are provided; published values and evidence boundaries are retained. Open a figure at full size to inspect small labels.
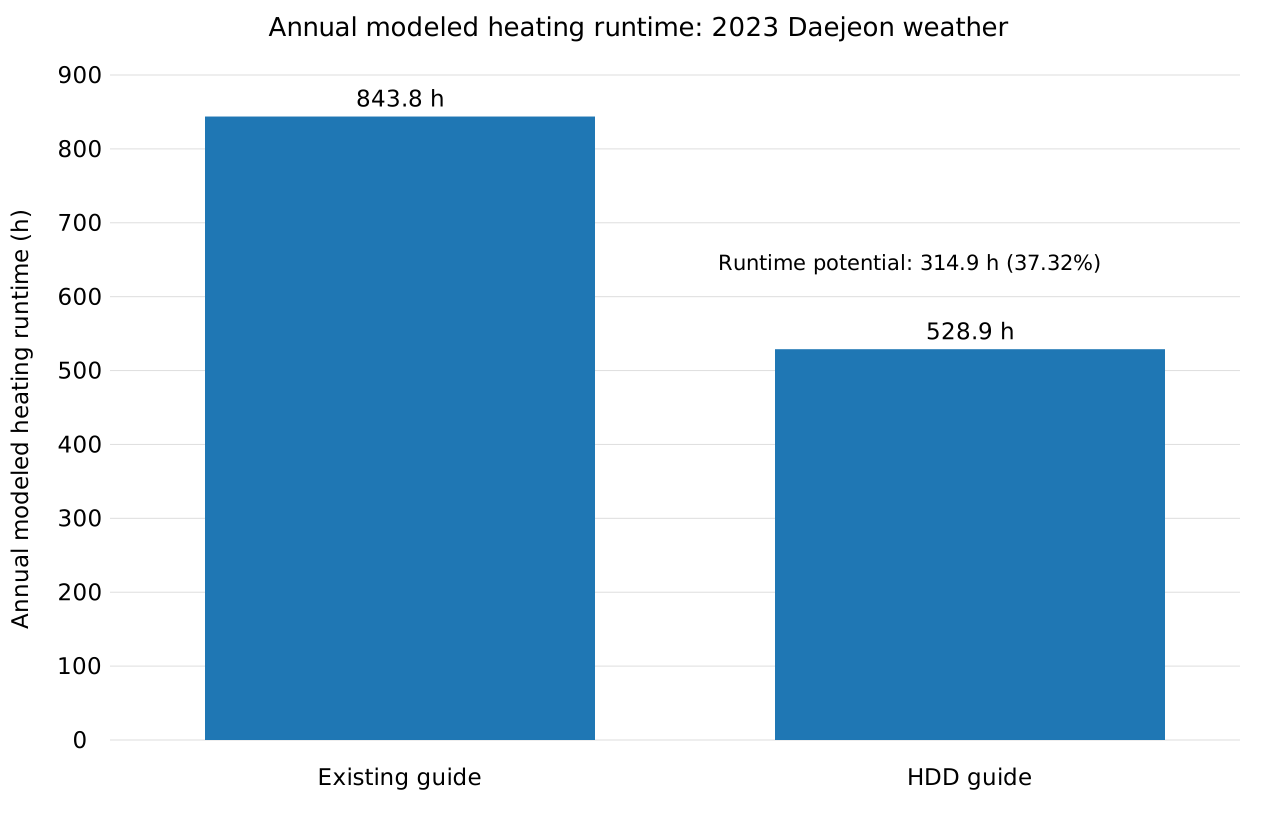
2023 Daejeon historical-weather simulation: 843.8 → 528.9 hours/year, runtime potential 314.9 hours / 37.32%. The chart is recreated from these explicit values; no fuel saving is inferred.
Open full-size figure ↗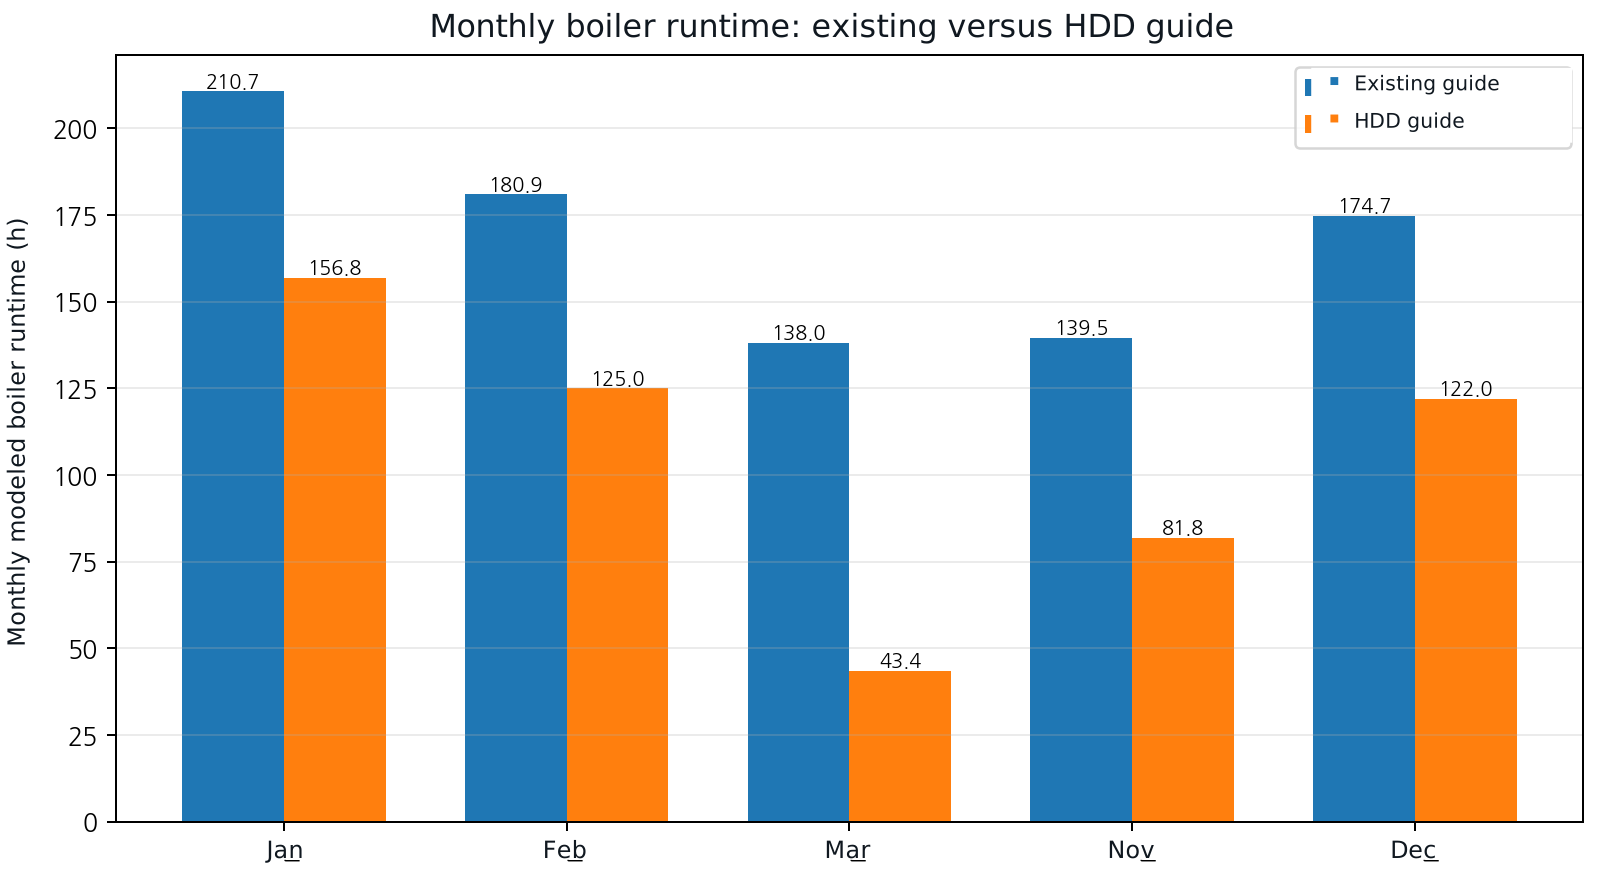
Published monthly modeled runtime under existing and HDD-based guides. Monthly values are rounded and need not exactly reconcile with the annual totals at displayed precision.
Open full-size figure ↗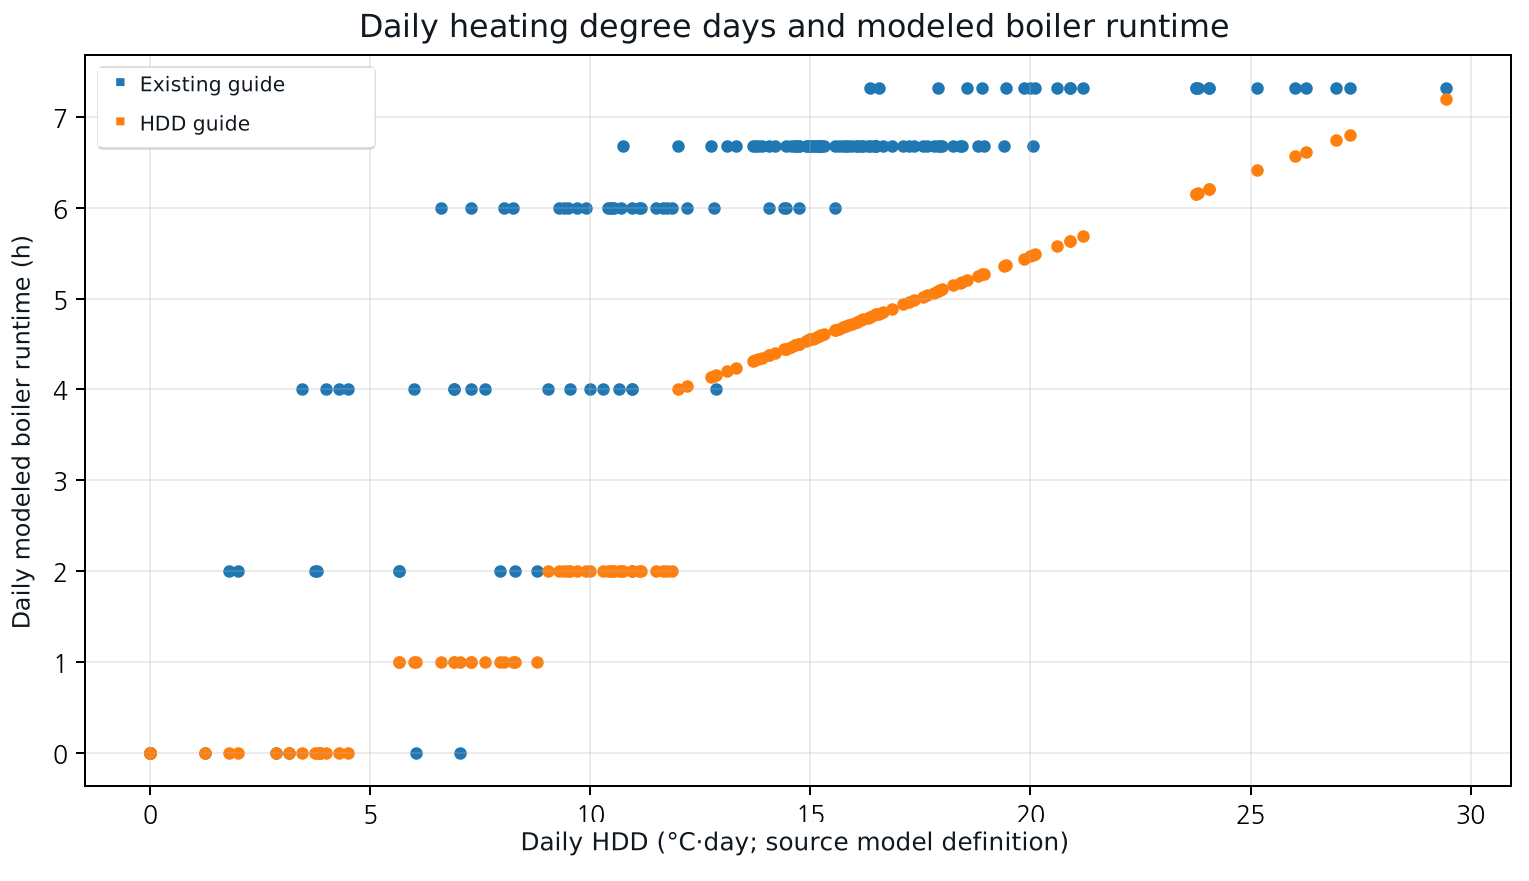
Original daily scatter points for the minimum-temperature schedule and HDD-based guide. These are modeled operating hours, not measured gas savings.
Open full-size figure ↗APPLY TO YOUR SITE
Connect your operating data to an actionable energy strategy.
Discuss the measurement boundary, data quality, operating constraints and verification approach for your facility.
Discuss your project All English cases