CASE84 · Manufacturing · Extrusion / Test & Adjust
Comparing three extrusion tests when production conditions change
Three anonymized tests distinguish matched-condition electricity reduction from production-normalized intensity improvement. The comparison screens repeatable operating opportunities without claiming annual savings.
01 · CASE ANALYSIS
Determine which comparisons are direct
Tests 1 and 2 had the same major production conditions: 220 minutes, 259.20 kg, 12,000 pieces and 91.67% time utilization.
Test 3 increased production and running time. Its electricity increase must be evaluated against the additional output rather than treated as worsening efficiency by itself.
02 · CASE ANALYSIS
Use the reported intensity values
Electricity was 402, 297 and 468 kWh for Tests 1, 2 and 3. Source intensities were 1.5494, 1.1443 and 1.2604 kWh/kg.
The published electricity and weight values are rounded. Retain the original analysis intensities instead of silently replacing them with ratios from rounded table values.
| Indicator | Test 1 | Test 2 | Test 3 |
|---|---|---|---|
| Running time | 220 min | 220 min | 310 min |
| Electricity | 402 kWh | 297 kWh | 468 kWh |
| Production / good pieces | 12,000 | 12,000 | 17,200 |
| Production weight | 259.20 kg | 259.20 kg | 371.52 kg |
| Time utilization | 91.67% | 91.67% | 93.94% |
| Reported intensity | 1.5494 kWh/kg | 1.1443 kWh/kg | 1.2604 kWh/kg |
03 · CASE ANALYSIS
Interpret each test result
Test 2 electricity fell approximately 26.12%, while reported intensity improved 26.15%. Matching production makes this the most direct test comparison.
Test 3 production rose 43.33% and running time 40.91%, but electricity rose 16.42%. Reported intensity improved 18.65% against Test 1; it was approximately 10.15% higher than Test 2.
04 · CASE ANALYSIS
Use the comparison as a screening result
The next question is whether Test 2 intensity can be reproduced at Test 3 production. Repeat matched tests while checking product mix, good output, warm-up, downtime and metering intervals.
Three tests do not establish annual verified savings, factory-wide performance or long-term persistence. Extend the work with a valid adjusted baseline and repeated observations.
| Indicator | Test 2 | Test 3 |
|---|---|---|
| Running time | 0.00% | +40.91% |
| Production weight | 0.00% | +43.33% |
| Electricity | −26.12% | +16.42% |
| Reported intensity | −26.15% | −18.65% |
Source-value comparison
Source figures · English edition
Figures correspond to those published in the Korean case. English titles, axes and legends are provided; published values and evidence boundaries are retained. Open a figure at full size to inspect small labels.
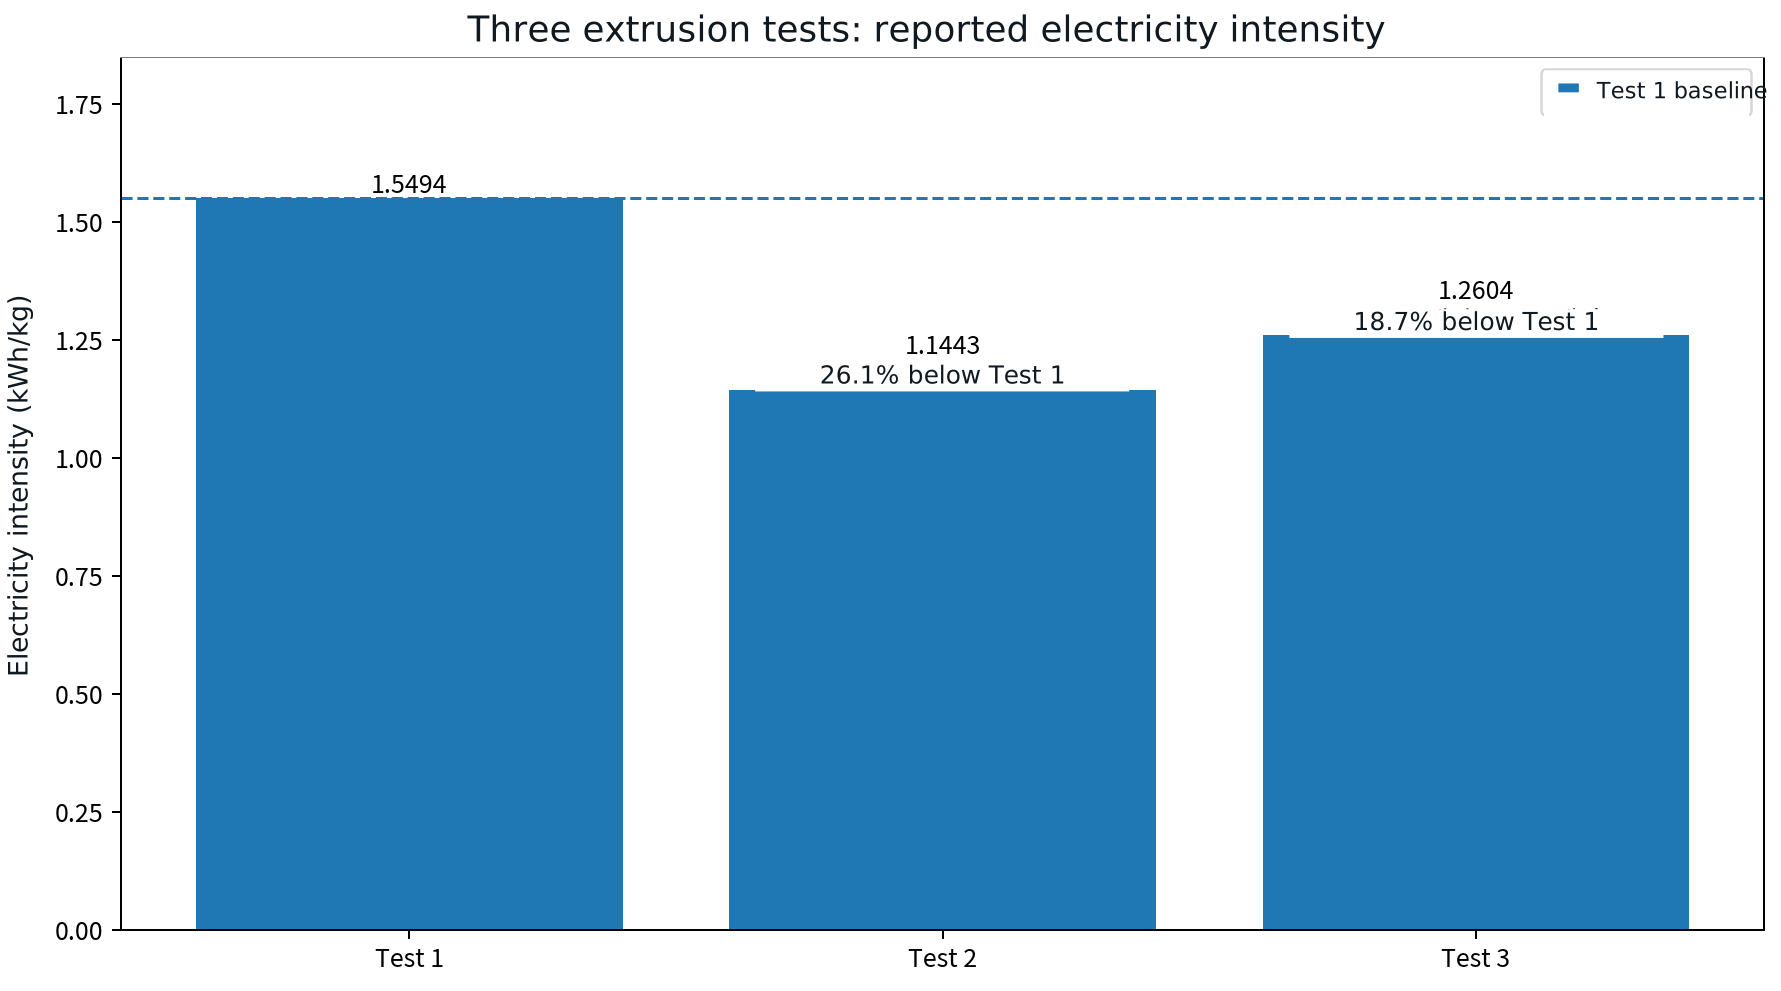
Three source test intensities: 1.5494 / 1.1443 / 1.2604 kWh/kg. Graphic annotations round improvements to 26.1% and 18.7%; source analysis reports 26.15% and 18.65%. These are test-level comparisons.
Open full-size figure ↗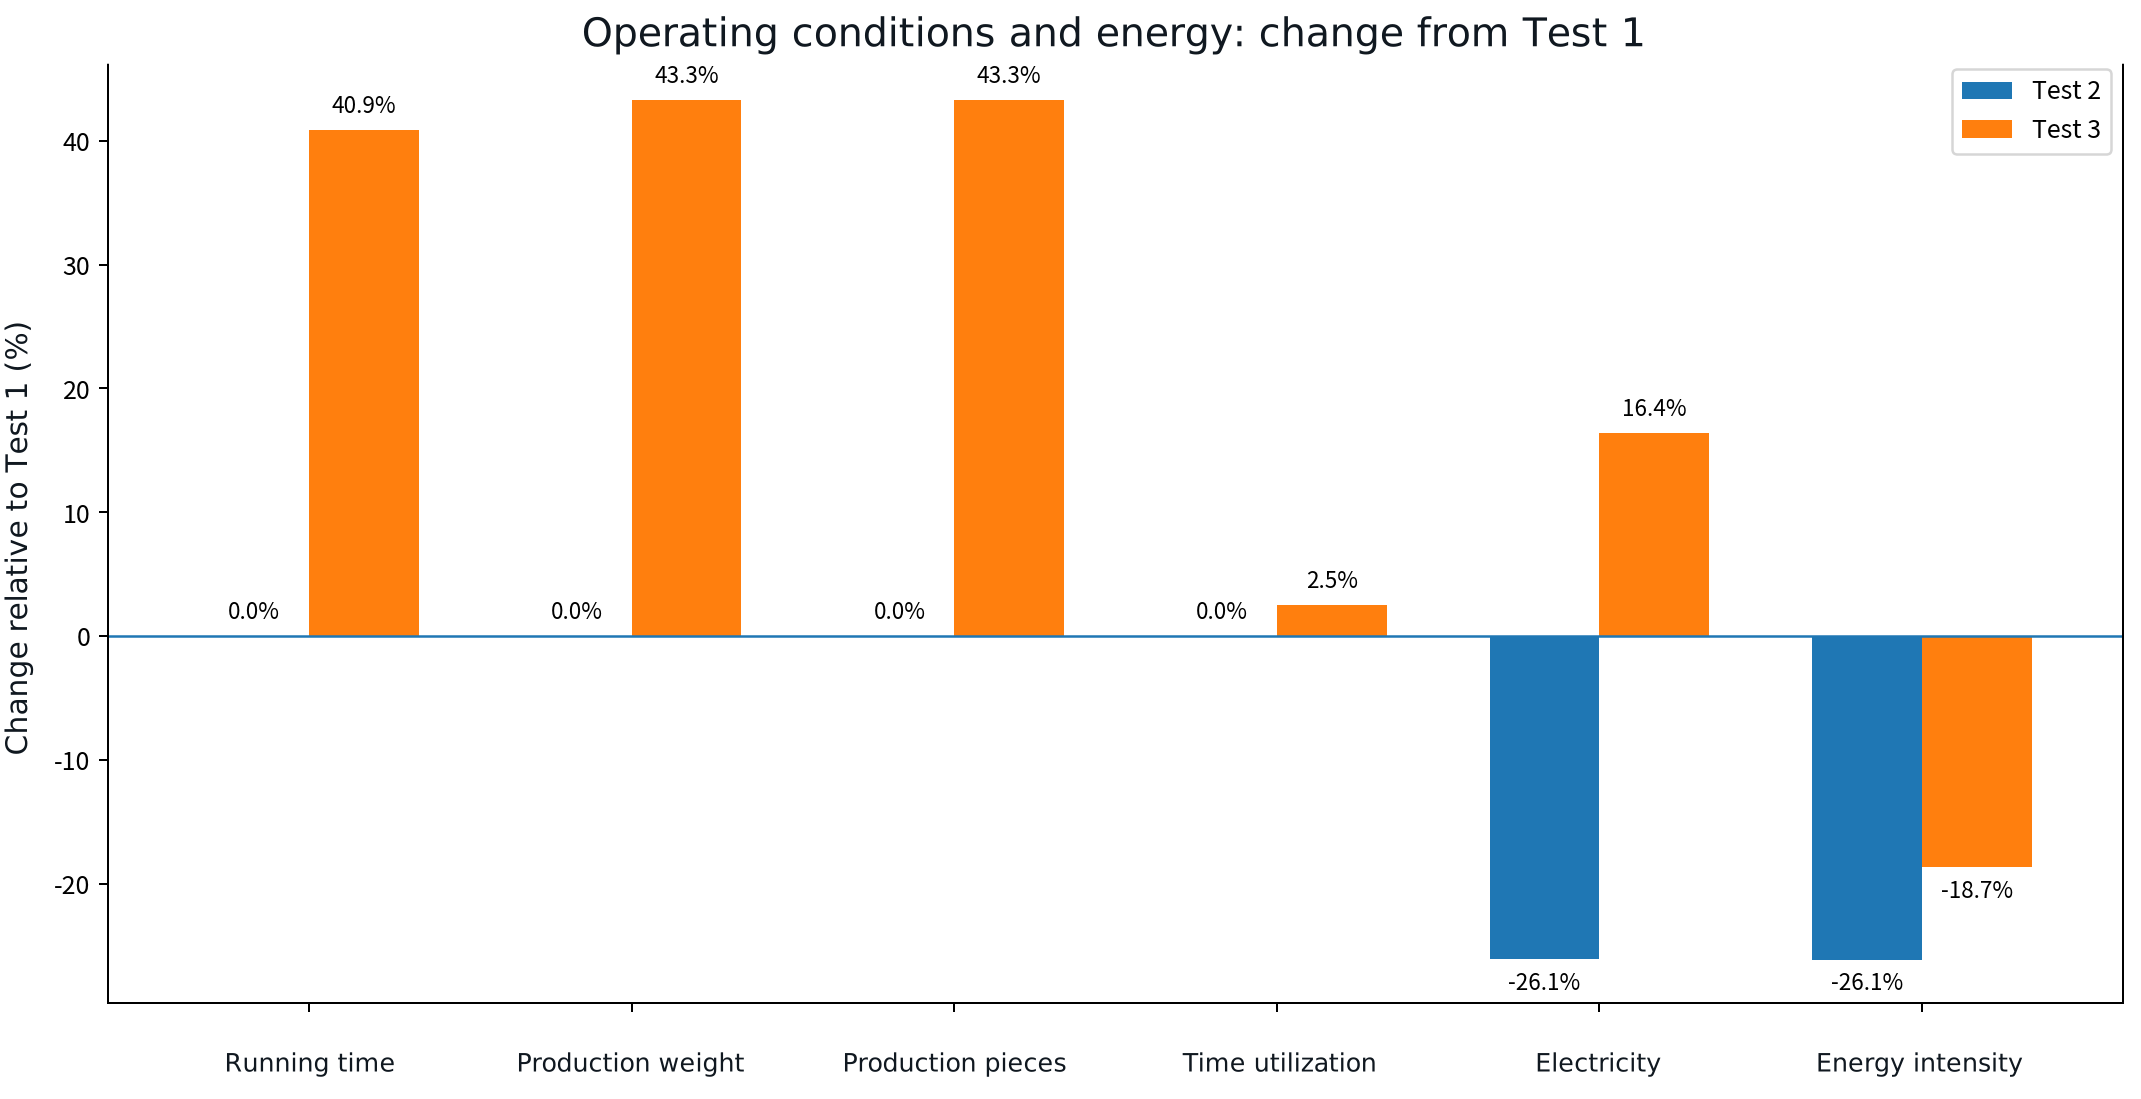
Changes relative to Test 1. Production and electricity changes are shown together; rounded graphic percentages retain source precision.
Open full-size figure ↗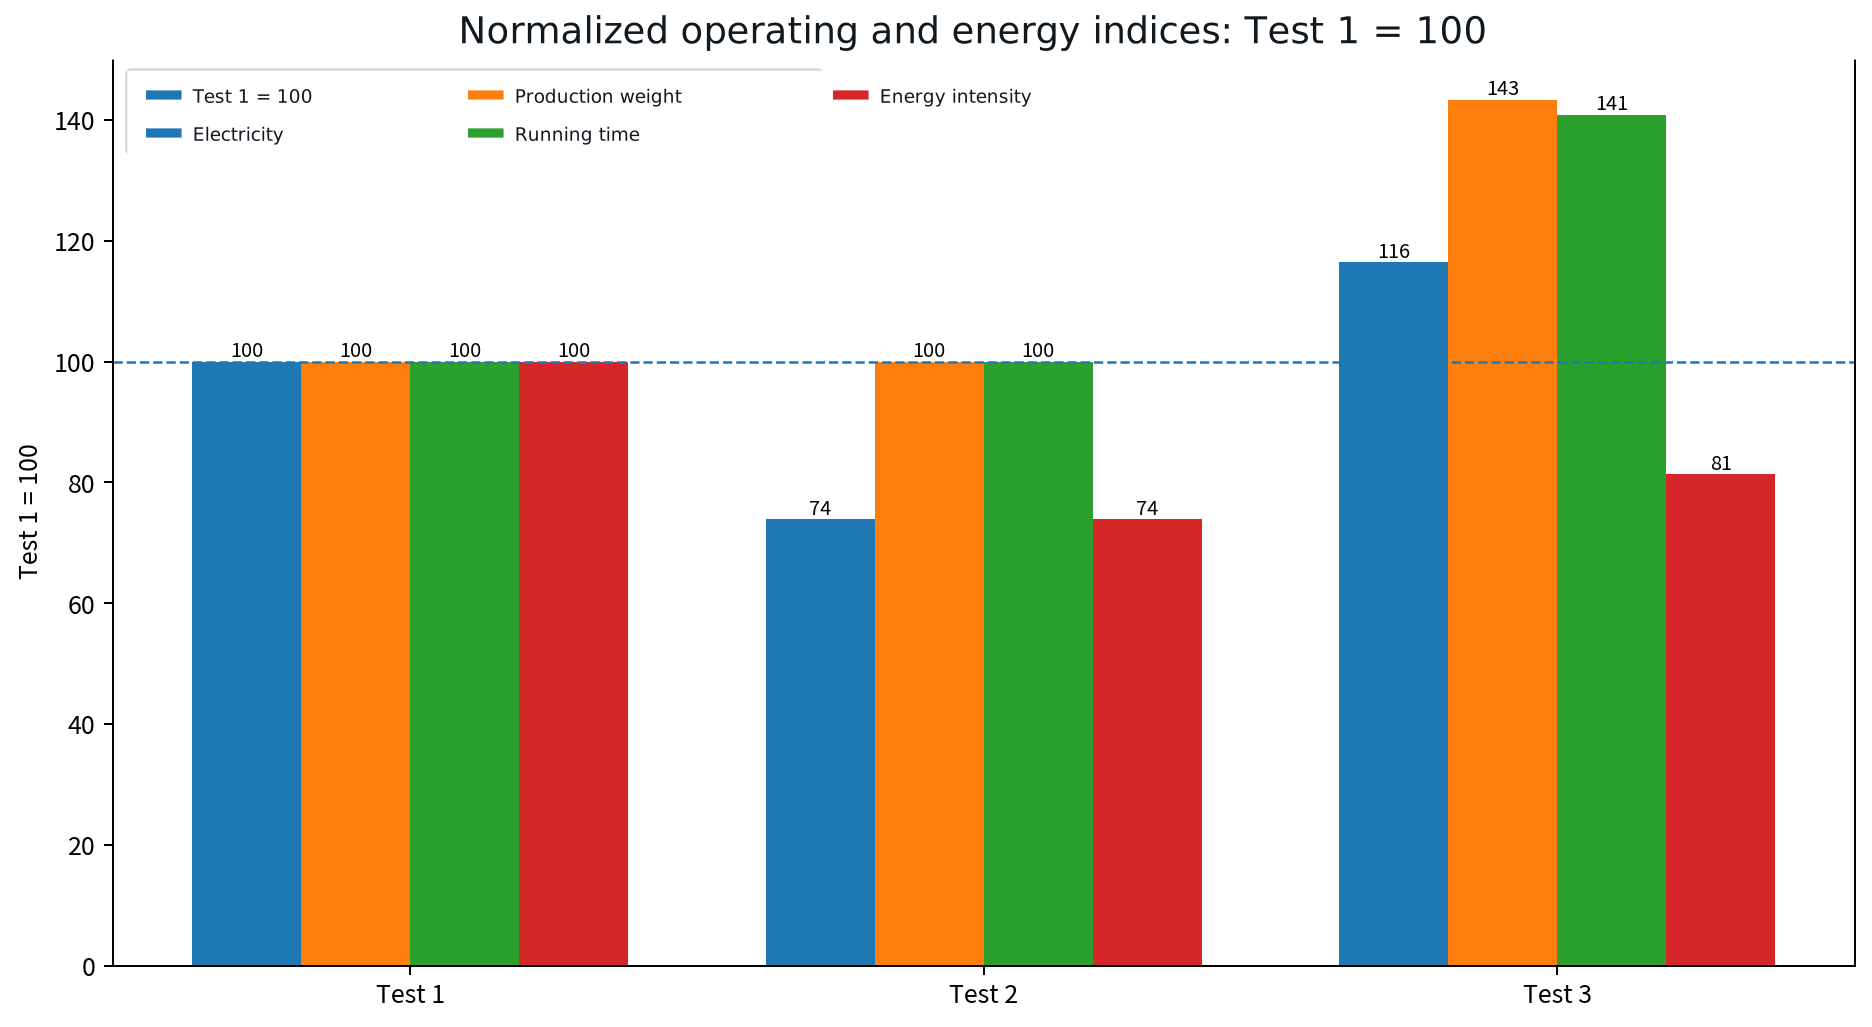
Test 1 = 100. The original bars and rounded indices are retained. Test 3 electricity rises less than production, while intensity remains above Test 2.
Open full-size figure ↗APPLY TO YOUR SITE
Connect your operating data to an actionable energy strategy.
Discuss the measurement boundary, data quality, operating constraints and verification approach for your facility.
Discuss your project All English cases