CASE83 · Manufacturing · Extrusion / Regression baseline
Cross-checking extrusion energy savings with intensity and regression baselines
Two anonymized automotive-parts extrusion lines are compared using production-normalized intensity and a multivariable baseline. Regression savings apply only to the observations accepted by the source validity rule.
01 · CASE ANALYSIS
Separate production change from efficiency
Reference LINE A retained its operating conditions while LINE B received improvements. Average electricity fell, but average production weight also fell, making raw electricity reduction an unsuitable savings metric.
The intensity comparison restricts the reference production range for comparability. Customer, factory and actual line identifiers are anonymized.
02 · CASE ANALYSIS
Method 1: production-normalized intensity
Average individual intensity changed from 0.234932 to 0.202304 kWh/kg, a reported 13.9% improvement. Mean electricity changed from 147.70 to 119.26 kWh and mean production from 627.45 to 596.21 kg.
The ratio of average electricity to average production gives a weighted intensity improvement of approximately 15.0%. This differs from averaging individual intensities and should be labeled separately.
| Indicator | LINE A | LINE B |
|---|---|---|
| Mean electricity | 147.70 kWh | 119.26 kWh |
| Mean production | 627.45 kg | 596.21 kg |
| Mean running time | 505.5 min | 519.4 min |
| Time utilization | 86.79% | 86.94% |
| Mean individual intensity | 0.234932 kWh/kg | 0.202304 kWh/kg |
03 · CASE ANALYSIS
Method 2: adjusted regression baseline
After comparing OLS, WLS and GLSAR and reviewing influential observations, the source selected GLSAR with AR(1) errors. The reported equation is E = −26.2148 + 0.8283 × time-utilization (%) + 0.1612 × production weight (kg).
Reported diagnostics were adjusted R² 0.801, RMSE 7.64 kWh, CV(RMSE) 4.73%, VIF 1.089 / 1.089 and Durbin–Watson 1.958. These describe the model, not a savings guarantee.
04 · CASE ANALYSIS
Report the valid subset and coverage
Of 50 reporting observations, 28 were valid (56.0%) and 22 invalid (44.0%). Valid adjusted-baseline electricity was 4,366.59 kWh against actual 3,683.00 kWh: 683.59 kWh, or 15.65%.
Reference production range was 493.95–881.10 kg and utilization 80.00–95.45%; reporting ranges were 80.10–747.60 kg and 65.15–95.83%. The original validity rule also used actual electricity, which can influence selection. For reuse, define eligibility from independent operating variables before evaluating savings.
| Item | Source result |
|---|---|
| Total / valid / invalid | 50 / 28 / 22 observations |
| Valid adjusted baseline | 4,366.59 kWh |
| Valid actual electricity | 3,683.00 kWh |
| Difference | 683.59 kWh |
| Valid-subset saving rate | 15.65% |
| Coverage | 56.0% of reporting observations |
05 · CASE ANALYSIS
Use both methods without combining results
The methods support the same improvement direction but apply different normalization and selection. Do not add 13.9% and 15.65%, or extrapolate the valid-subset kWh to the whole factory.
Collect broader baseline coverage, product mix, quality, downtime and synchronized metering for subsequent evaluation. Report model uncertainty and excluded observations alongside savings.
Source-value comparison
Source figures · English edition
Figures correspond to those published in the Korean case. English titles, axes and legends are provided; published values and evidence boundaries are retained. Open a figure at full size to inspect small labels.
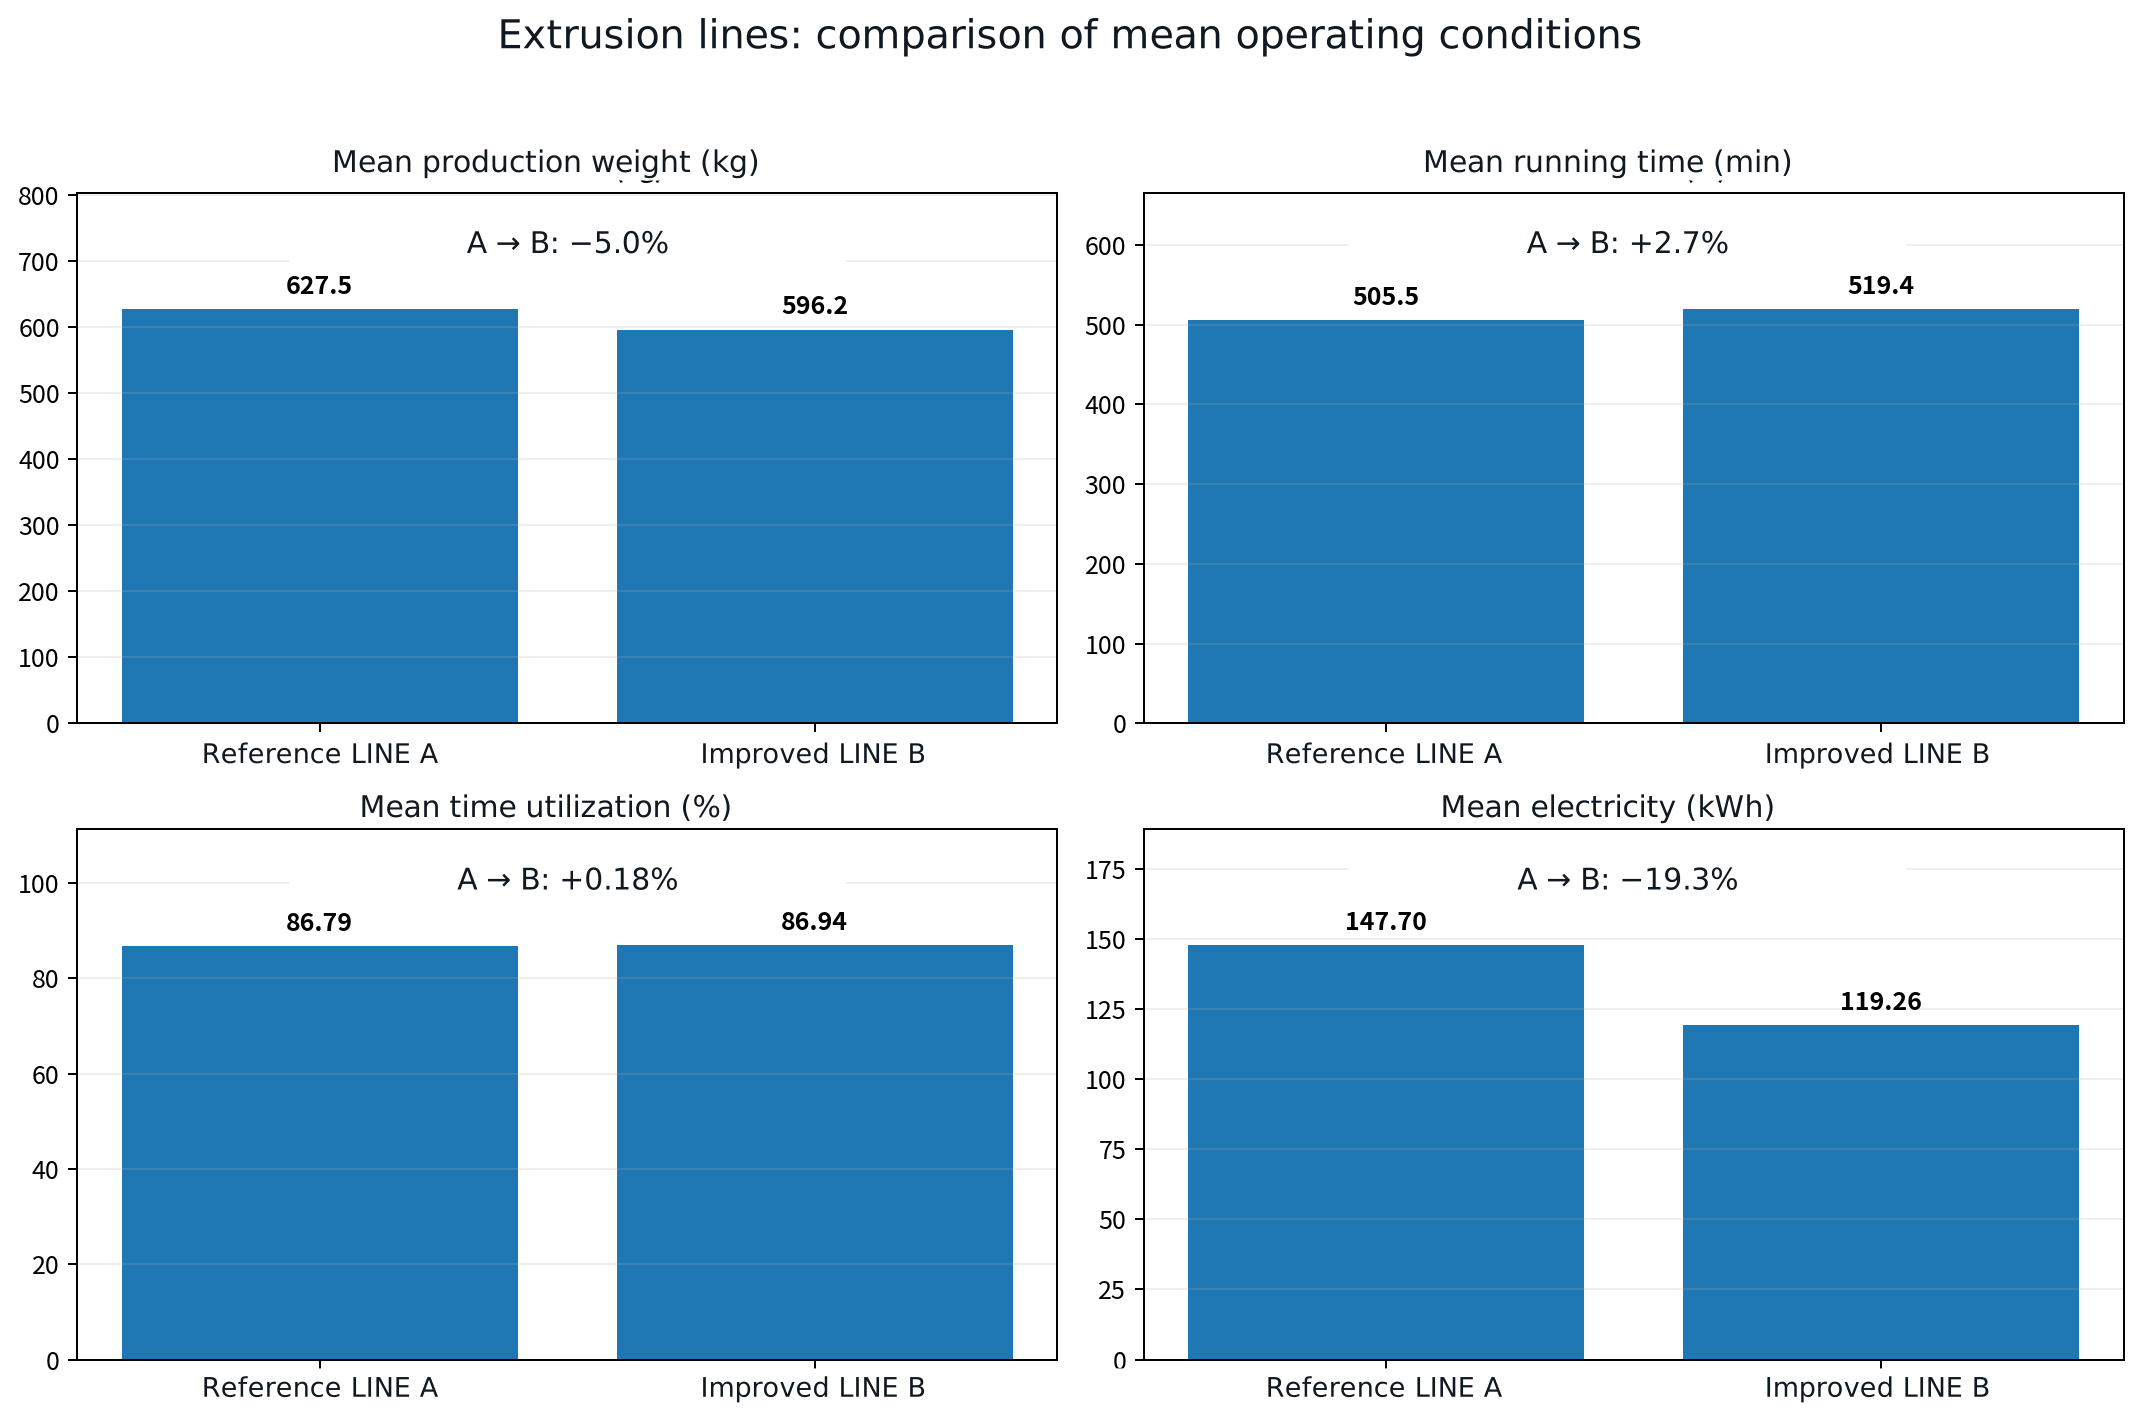
Mean operating conditions of reference LINE A and improved LINE B. Production changes −5.0%, running time +2.7%, utilization +0.18% (relative source change) and electricity −19.3%. Raw electricity reduction includes production effects.
Open full-size figure ↗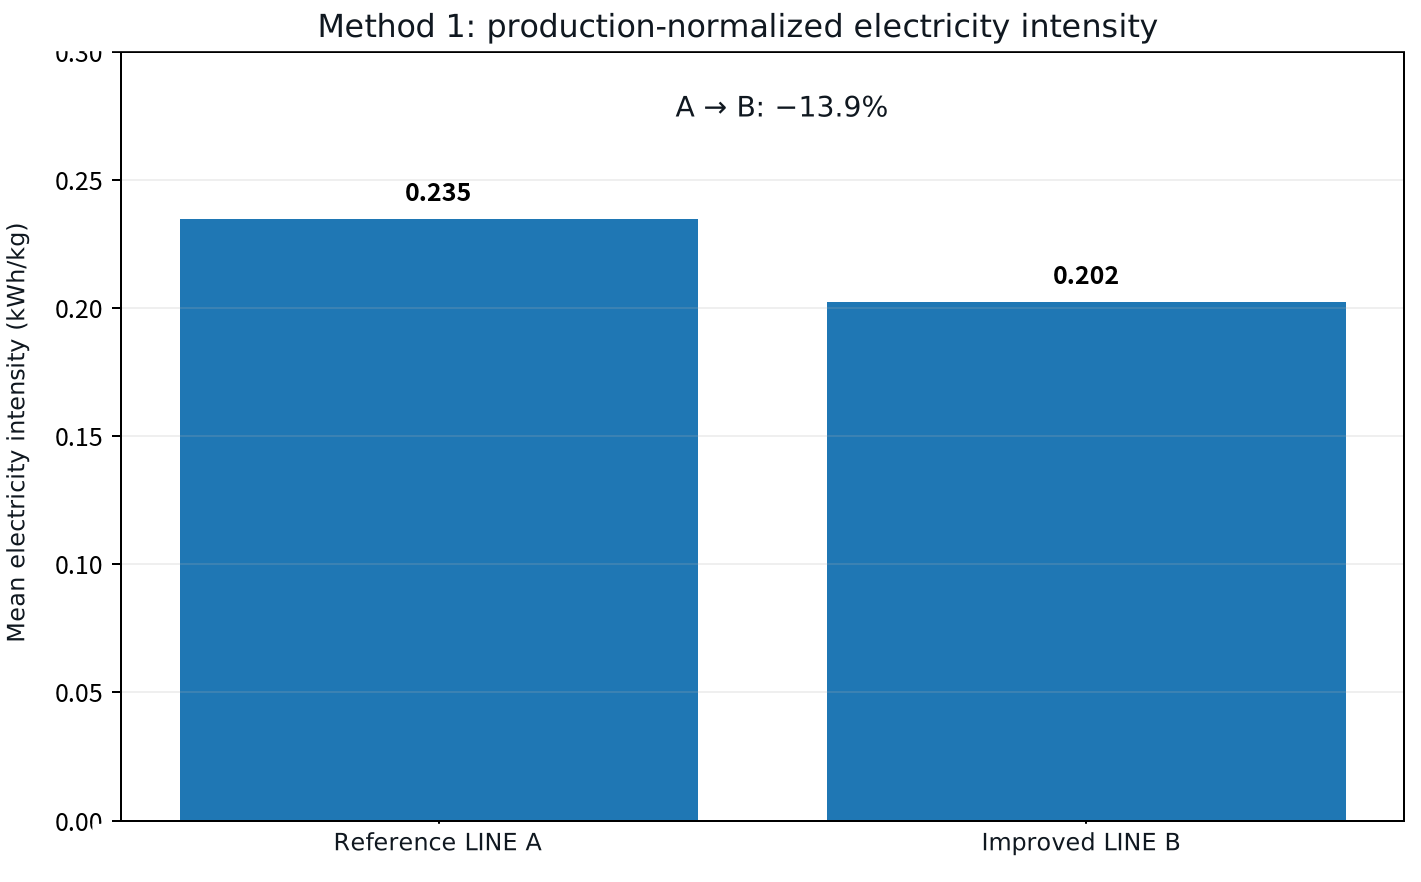
Reported mean individual intensity: 0.234932 → 0.202304 kWh/kg, 13.9% improvement. The graphic rounds the displayed bars to 0.235 and 0.202.
Open full-size figure ↗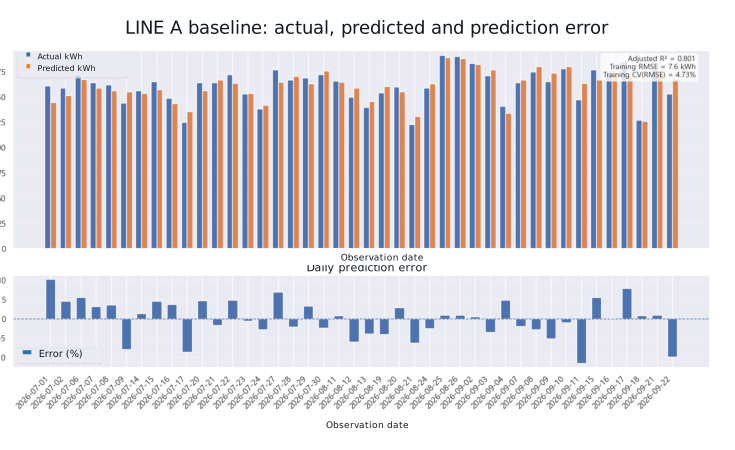
Published reference-period actual/predicted electricity and daily prediction errors, with source dates and original bars retained. Graphic diagnostics are rounded; detailed case reports RMSE 7.64 kWh and CV(RMSE) 4.73%. The supplied source image already clips some left-axis digits; this edition does not infer missing digits.
Open full-size figure ↗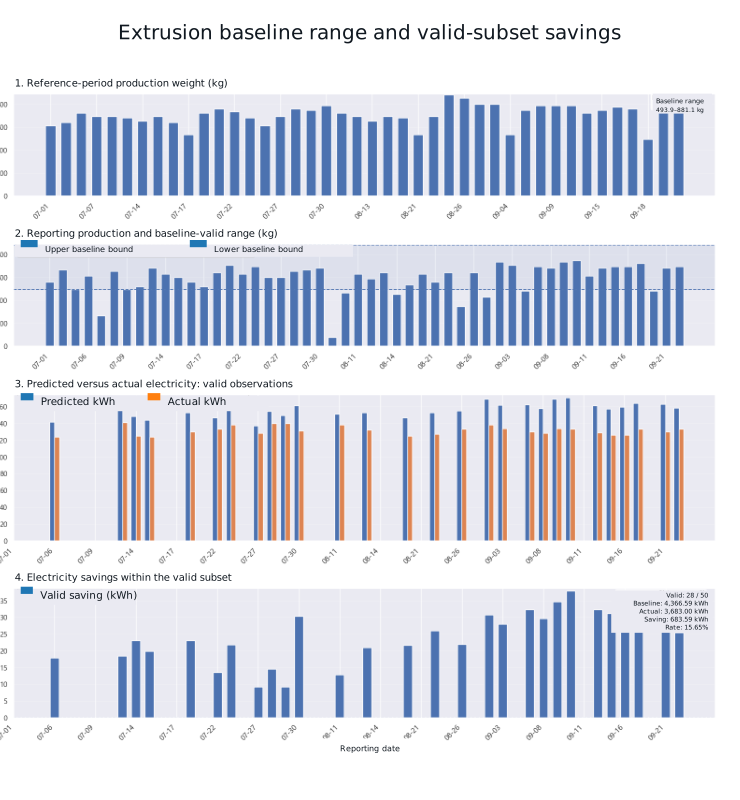
Published baseline range, reporting production, valid-observation actual/predicted electricity and saving bars. Only 28 of 50 reporting observations are valid in the original rule; that rule includes actual electricity. Result 683.59 kWh / 15.65% is not extrapolated to excluded observations. Some left-axis digits are already clipped in the supplied source image.
Open full-size figure ↗APPLY TO YOUR SITE
Connect your operating data to an actionable energy strategy.
Discuss the measurement boundary, data quality, operating constraints and verification approach for your facility.
Discuss your project All English cases