CASE66 · Manufacturing · Boiler load and capacity combinations
Comparing boiler capacity combinations to avoid inefficient low-load operation
Field analysis identifies increasing specific fuel consumption below a source load range. Tests compare a single larger boiler with two smaller units while dispatch criteria remain tied to steam service.
01 · CASE ANALYSIS
Lower fuel use is not necessarily better intensity
A boiler can consume less total gas while requiring more gas per tonne of steam at low output. Fixed, standby or cycling losses may become more significant.
The source observed increased intensity below approximately 40% load. This is a project observation, not every boiler’s turndown or cycling limit.
02 · CASE ANALYSIS
Recorded capacity tests
The source sequence used unit #2 at 30 tonnes/hour up to 20 October, unit #3 at 30 tonnes/hour during 20–21 October, then units #1 and #5 at 15 tonnes/hour each during 21–23 October.
The capacity table documents test combinations; it does not provide the missing paired intensity results needed to select a universally superior combination.
| Period | Online units | Rated capacity |
|---|---|---|
| Up to 20 October | #2 | 30 tonnes/hour |
| 20–21 October | #3 | 30 tonnes/hour |
| 21–23 October | #1 + #5 | 15 tonnes/hour × 2 |
03 · CASE ANALYSIS
Define load and fuel at the system level
Relate actual steam output to the sum of online rated capacity. Record gas, steam, pressure, unit availability and burner behavior on the same time axis.
Compare matched steam-demand regions and stable conditions. Two smaller boilers have the same combined rated capacity here but different individual operating characteristics.
04 · CASE ANALYSIS
Build feasible dispatch bands
Consider unit efficiency curves, minimum firing, start/stop behavior, pressure control and reserve. Add adequate hysteresis/runtime conditions when implementing staging.
A modern condensing hot-water boiler can have different part-load behavior from the industrial steam boilers described by this case.
| Input | Purpose |
|---|---|
| Steam flow | Demand and load factor |
| Gas flow | Fuel intensity |
| Online units and rated capacity | Staging and load allocation |
| Steam pressure | Service stability |
| Burner state / firing rate | Cycling and minimum-load effects |
| Stack/O₂ and feedwater conditions | Additional diagnostic context |
05 · CASE ANALYSIS
Evidence and related cases
CASE65’s 66.62/70.12 comparison, approximately 5% and annualized benefit belong to its changeover result and are not counted again as CASE66 savings.
The outcome here is field analysis and a test/dispatch framework, without an isolated final saving rate or annual amount.
Source figures · English edition
Figures correspond to those published in the Korean case. English titles, axes and legends are provided; published values and evidence boundaries are retained. Open a figure at full size to inspect small labels.
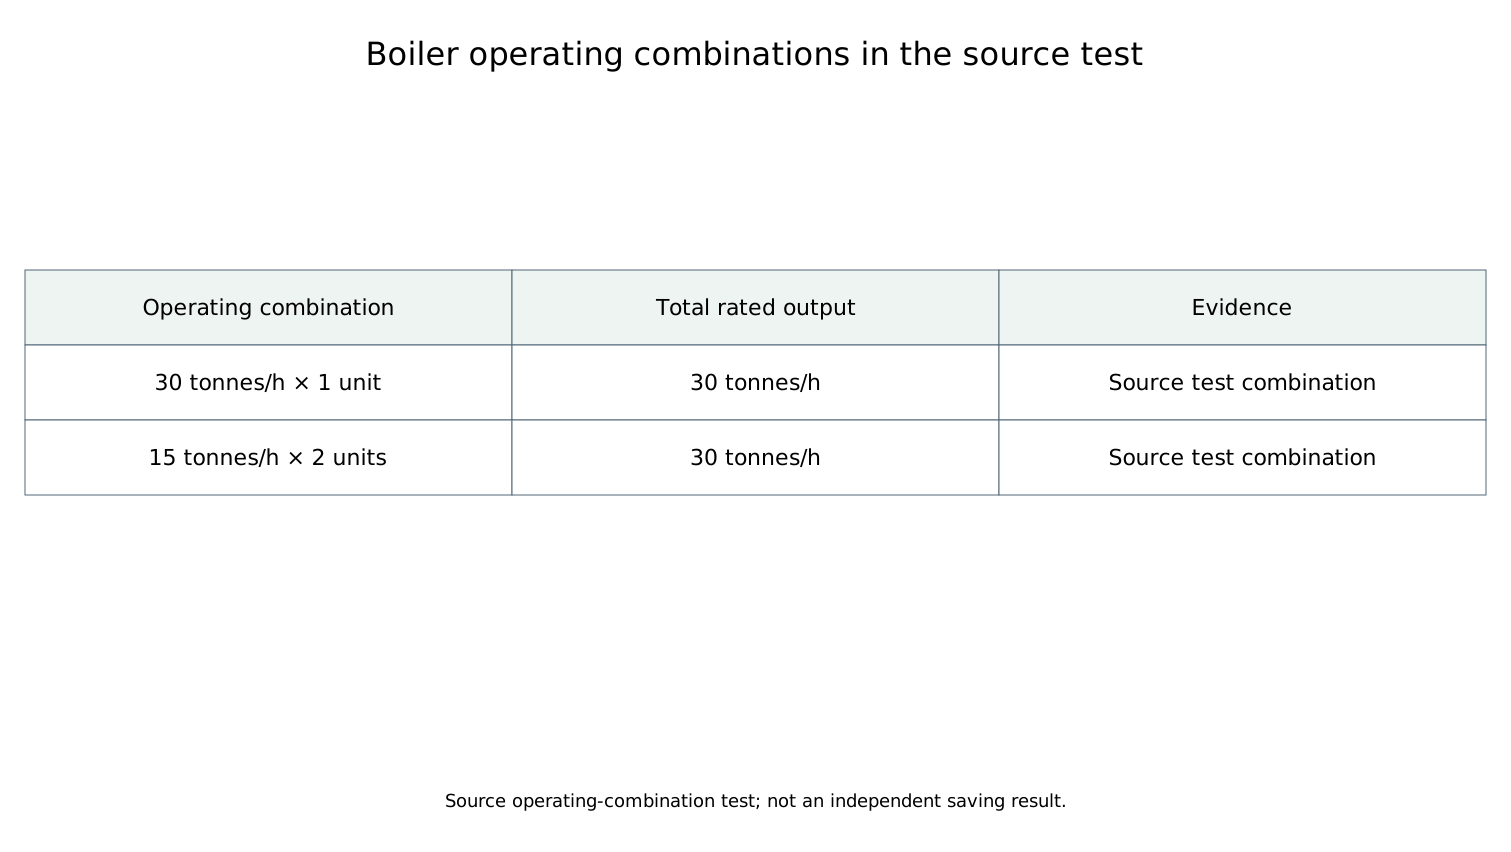
Source test compares 30 tonnes/h × 1 boiler with 15 tonnes/h × 2 boilers. Both combinations total 30 tonnes/h rated output; this is test configuration evidence.
Open full-size figure ↗APPLY TO YOUR SITE
Connect your operating data to an actionable energy strategy.
Discuss the measurement boundary, data quality, operating constraints and verification approach for your facility.
Discuss your project All English cases