CASE65 · Manufacturing · Boiler changeover and dispatch
Choosing boilers by measured fuel per tonne of steam
Two equal-capacity boilers are compared through actual changeover operation. Fuel intensity, steam load and supply conditions support efficient priority selection while the annual benefit retains its historical calculation basis.
01 · CASE ANALYSIS
Equivalent capacity does not mean equivalent efficiency
Boiler condition, burner behavior and loading affect fuel per tonne of steam. The source used measured gas and steam rather than nameplate capacity alone.
The actual action prioritized the boiler with lower specific fuel consumption after a changeover test.
02 · CASE ANALYSIS
Measured unit difference
Unit #2 and #3 were both rated 30 tonnes/hour. Their source fuel intensities were 66.62 and 70.12 Nm³/tonne, a difference of 3.5 Nm³/tonne.
Changing #3 to #2 was reported at approximately 5% lower intensity. Source identifiers describe this project and are not transferable unit preferences.
| Indicator | Unit #2 | Unit #3 |
|---|---|---|
| Rated steam capacity | 30 tonnes/hour | 30 tonnes/hour |
| Specific fuel use | 66.62 Nm³/tonne | 70.12 Nm³/tonne |
| Difference | 3.5 Nm³/tonne lower | Reference |
03 · CASE ANALYSIS
Selection, staging and loading belong together
The same material noted worsening intensity below approximately 40% load. Selecting the best unit is insufficient if several machines remain at inefficient low load.
Maintain steam demand and pressure and compare equivalent loading. Feedwater, blowdown, return condensate and combustion checks improve comparison quality but are not all supplied as measured values here.
04 · CASE ANALYSIS
Historical annualization
The report used a 3.5 Nm³/tonne difference, around 25 tonnes/hour steam, 3,600 hours/year and KRW 595.5/Nm³ gas price. This yields approximately KRW 187.6 million/year.
The source also summarizes this as approximately KRW 180 million/year. Both are retained as detailed and rounded report figures rather than falsely treated as separate benefits.
| Assumption | Source value |
|---|---|
| Specific-fuel difference | 3.5 Nm³/tonne |
| Mean steam production | 25 tonnes/hour |
| Applicable hours | 3,600 h/year |
| Historical gas tariff | KRW 595.5/Nm³ |
| Calculated benefit | Approximately KRW 187.6 million/year |
| Rounded source expression | Approximately KRW 180 million/year |
05 · CASE ANALYSIS
Repeat performance checks
Construct load-dependent fuel curves, identify persistent poor performers and repeat tests after maintenance. Choose feasible combinations that maintain reliable steam.
The source changeover result does not establish that its exact percentage or cost will recur at another plant.
Source-value comparisons
Source figures · English edition
Figures correspond to those published in the Korean case. English titles, axes and legends are provided; published values and evidence boundaries are retained. Open a figure at full size to inspect small labels.
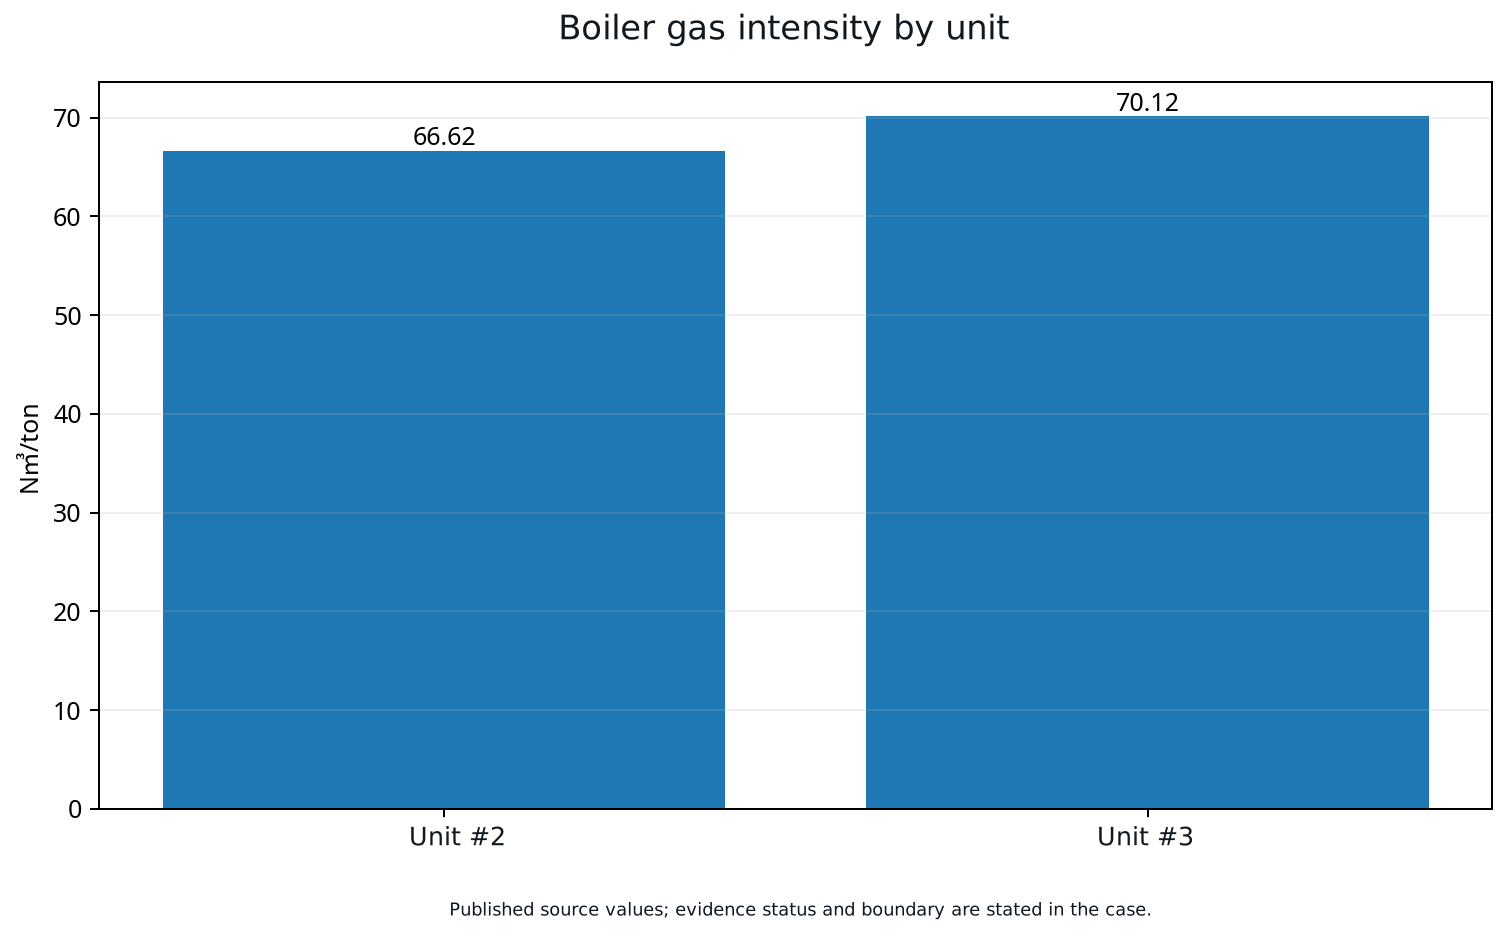
Reported boiler gas intensities: Unit #2 66.62 and Unit #3 70.12 Nm³/tonne (source graphic prints Nm³/ton). The figure itself does not establish annual verified savings.
Open full-size figure ↗APPLY TO YOUR SITE
Connect your operating data to an actionable energy strategy.
Discuss the measurement boundary, data quality, operating constraints and verification approach for your facility.
Discuss your project All English cases