CASE64 · Manufacturing · Chiller staging program
Distinguishing an eight-to-seven-unit staging change from the broader program result
Historical excess online capacity led to staged operation changes within a real-time utility-efficiency program. The reported 27% intensity improvement reflects combined program activities, not one stopped chiller alone.
01 · CASE ANALYSIS
Installed reserve differs from running reserve
Reliable plant capacity does not require every reserve unit to consume energy continuously. Assess online chiller count and associated pumps against actual cooling demand.
Part-load curves and auxiliary power determine efficient staging rather than a rule that fewer units are always better.
02 · CASE ANALYSIS
Source diagnosis and applied change
Historical 5°C data indicated six analytically required units versus eight running, with source load around 75%.
The actual program later changed operation from eight to seven. The analytical six-unit value is not presented as the achieved operating count.
| Stage | Source observation |
|---|---|
| Historical analytical need | 6 units |
| Historical actual operation | 8 units; approximately 75% load |
| Applied program operation | 8 → 7 units |
| Broader reported intensity | 1.20 → 0.88 kW/RT; approximately 27% |
| Attribution | Combined program activity, not shutdown-only saving |
03 · CASE ANALYSIS
Real-time program rather than an isolated switch
The project installed metering and analysis for chillers, CDA and boilers, then progressed to tests and operating guidance.
Unit efficiency, load allocation, operating conditions and poor-performing equipment were reviewed alongside staging.
04 · CASE ANALYSIS
Keep the outcome attribution correct
The program material records eight-to-seven operation and approximately 27% equipment-intensity improvement, with broader records showing 1.20 → 0.88 kW/RT.
These combined results cannot all be credited to one shutdown. Project-wide monetary totals have different dates/scopes and are not assigned as CASE64’s isolated benefit.
| Decision input | Purpose |
|---|---|
| Plant RT and unit performance curves | Efficient feasible combinations |
| Pump/tower auxiliary power | Total plant boundary |
| Operating limits and reserve | Maintain reliable cooling |
| Temperature and stable runtime | Avoid unsuitable or unstable staging |
| Adjusted before/after data | Verify program outcome |
05 · CASE ANALYSIS
Operating constraints and verification
Review service temperature, remaining-unit limits, pump flow and reserve before staged reduction. Use hysteresis and adequate runtime conditions when translating tests to controls.
Track total plant intensity over comparable cooling demand and condenser conditions, not only the count of running units.
Source-value comparisons
Source figures · English edition
Figures correspond to those published in the Korean case. English titles, axes and legends are provided; published values and evidence boundaries are retained. Open a figure at full size to inspect small labels.
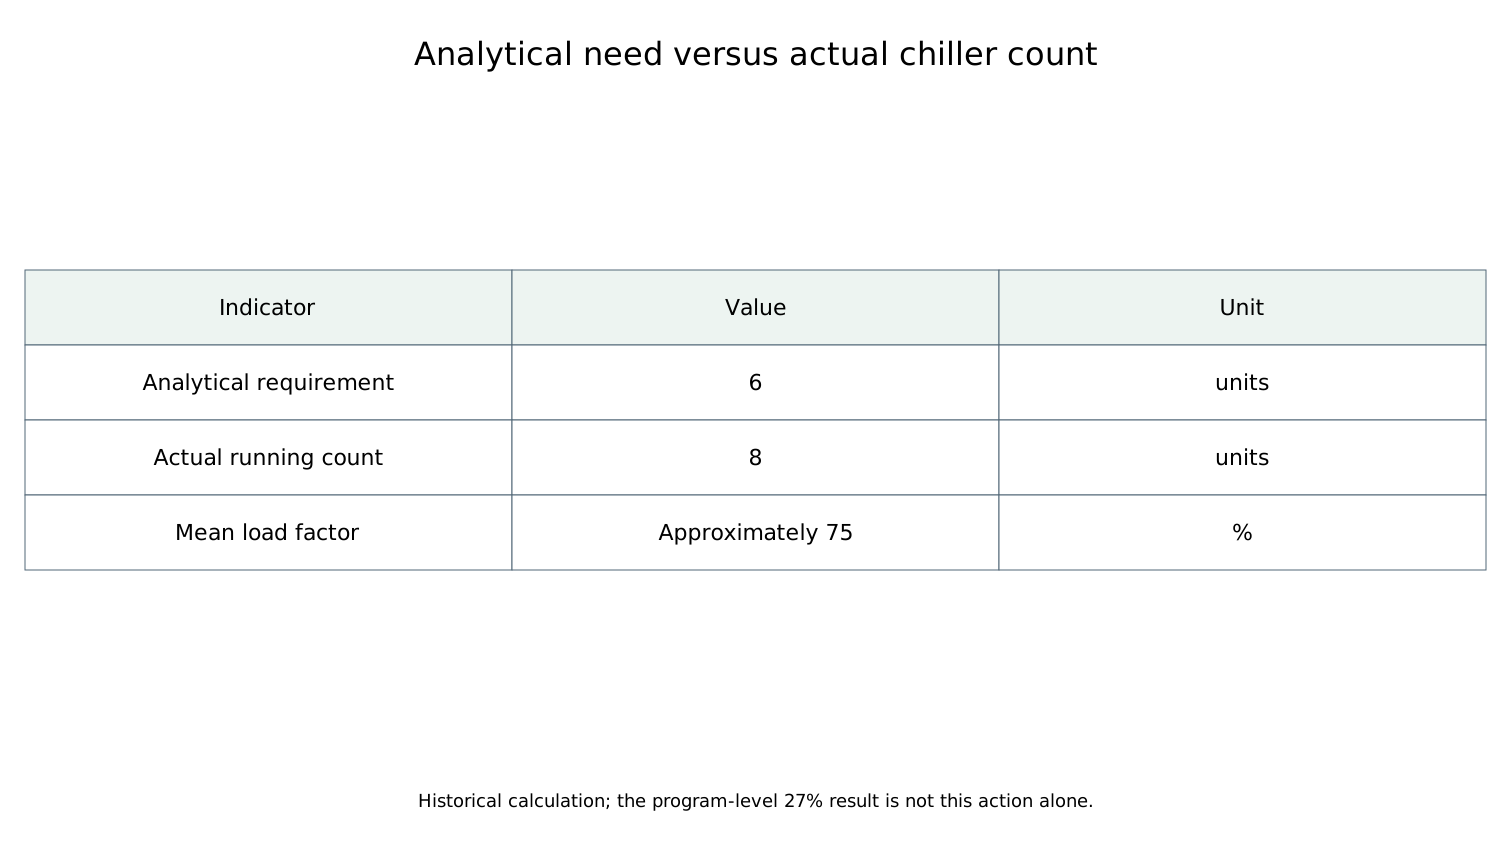
Historical analytical requirement 6, actual running count 8 and mean loading approximately 75%. The program-level 27% result is not attributable to this count comparison alone.
Open full-size figure ↗APPLY TO YOUR SITE
Connect your operating data to an actionable energy strategy.
Discuss the measurement boundary, data quality, operating constraints and verification approach for your facility.
Discuss your project All English cases