CASE63 · Manufacturing · Chiller load redistribution
Loading the efficient chiller through measured hydraulic redistribution
A 13°C section had its most efficient chiller at the lowest load. Chilled-water pump discharge valves redistributed cooling output, and the result was evaluated at the combined system boundary.
01 · CASE ANALYSIS
Selection is not enough
Choosing an efficient unit does not ensure that it receives an efficient share of the load. The source found the best-performing running unit at only 60% load while two other units ran near 95–105%.
This changed the diagnostic question from which unit to start to how cooling demand was distributed.
02 · CASE ANALYSIS
Source unit observations
The three units had intensities 0.417, 0.399 and 0.324 kW/RT, with loads 105%, 95% and 60%. The source labels are retained as anonymized identifiers.
Measure individual flow, ΔT, RT and kW before attributing the difference to equipment condition or hydraulic distribution.
| Indicator | Unit 21 | Unit 22 | Unit 23 |
|---|---|---|---|
| Specific energy | 0.417 kW/RT | 0.399 kW/RT | 0.324 kW/RT |
| Load factor | 105% | 95% | 60% |
03 · CASE ANALYSIS
Actual adjustment
The completion report specified changing chilled-water pump discharge-valve openings to adjust loading. A staged test allowed the more efficient unit to take additional load.
Individual machine intensity may change as load moves. The final comparison uses total operating power divided by total cooling output.
04 · CASE ANALYSIS
Reported system benefit
System intensity improved by 0.038 kW/RT, from 0.594 to 0.556. Applied to the source reference load of 5,200 RT, this corresponds to 197.6 kW.
The report annualized the result using 8,760 hours/year and historical KRW 59.4/kWh, approximately KRW 102 million/year. This is a report-based annualization, not an independently metered annual saving.
| Quantity | Source value |
|---|---|
| System before / after | 0.594 / 0.556 kW/RT |
| Intensity difference | 0.038 kW/RT |
| Reference cooling load | 5,200 RT |
| Power reduction | 197.6 kW |
| Annual hours / historical tariff | 8,760 h / KRW 59.4 per kWh |
| Annualized cost benefit | Approximately KRW 102 million |
05 · CASE ANALYSIS
Long-term operating rule
Maintain process cooling and manufacturer flow/load limits. Once the load allocation is established, evaluate speed/differential-pressure control to reproduce it with less throttling.
Do not generalize that every chiller should run at maximum load; plant efficiency depends on unit curves, lift and auxiliaries.
Source-value comparisons
Source figures · English edition
Figures correspond to those published in the Korean case. English titles, axes and legends are provided; published values and evidence boundaries are retained. Open a figure at full size to inspect small labels.
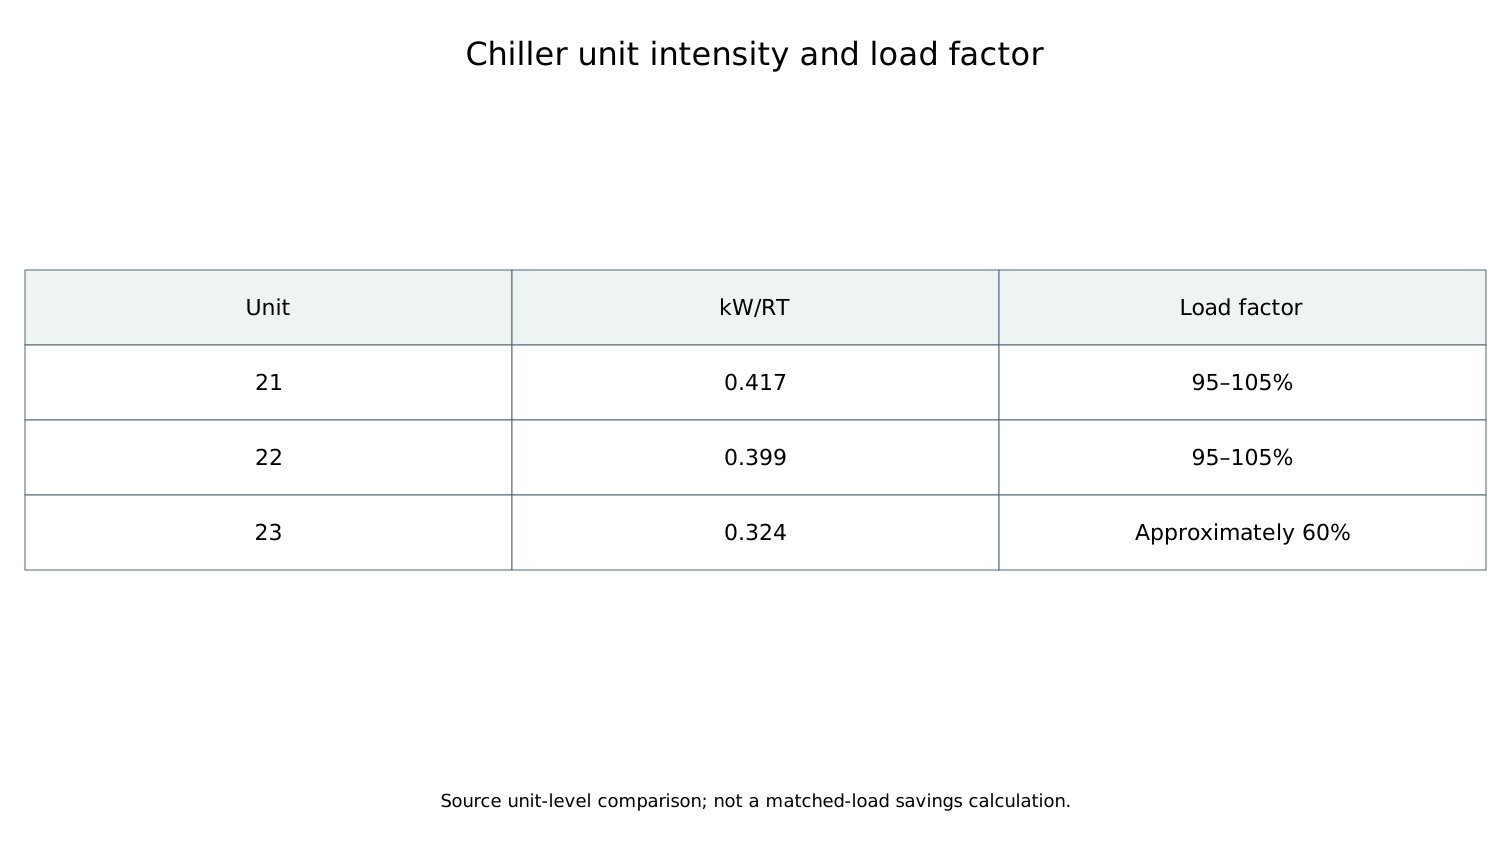
The figure groups Units 21 and 22 in a 95–105% loading band, and Unit 23 at approximately 60%. Intensities are 0.417 / 0.399 / 0.324 kW/RT. This source figure uses grouped/rounded loading information; the detailed case gives the individual operating observations.
Open full-size figure ↗APPLY TO YOUR SITE
Connect your operating data to an actionable energy strategy.
Discuss the measurement boundary, data quality, operating constraints and verification approach for your facility.
Discuss your project All English cases