CASE56 · Manufacturing · Chiller changeover tests
Setting chiller operating priority from measured changeover tests
Actual operating units are changed while cooling output and power are measured. Specific energy distinguishes efficiency improvement from changes in the amount of cooling delivered.
01 · CASE ANALYSIS
Choose units from actual performance
Similar rated chillers can differ because of age, heat-exchanger condition, refrigerant, sensors and operating lift. Fixed numbering does not establish the most efficient dispatch.
The project used an efficiency-management system and real unit changeovers to test operating priority.
02 · CASE ANALYSIS
The two field tests
On 16 July, changing #10 to #9 reduced kW/RT by 6.6%, but demand increased and total consumption rose. On 17 July, changing #4 to #3 reduced intensity by 15% with approximately 150 kW lower power in the 5°C section.
The numbers label anonymized units in the source. They are project identifiers, not recommendations to operate the same numbered unit elsewhere.
| Date | Changeover | Intensity result | Total-energy interpretation |
|---|---|---|---|
| 16 July | #10 → #9 | 6.6% lower kW/RT | Higher cooling load increased total consumption |
| 17 July | #4 → #3 | 15% lower kW/RT | Approximately 150 kW lower 5°C-section power |
03 · CASE ANALYSIS
Normalize to delivered cooling
Calculate RT from aligned chilled-water flow and supply/return temperatures, then divide measured chiller kW by RT.
Compare load, chilled-water setpoint and condenser-water conditions. A lower intensity can accompany higher total electricity when more cooling is delivered.
04 · CASE ANALYSIS
Build load-dependent priority
Collect low-, medium- and high-load performance curves. Compare feasible unit combinations rather than assuming a single test establishes a permanent ranking.
Include chilled-water pumps, condenser-water pumps and tower fans when progressing from chiller-only to plant-level dispatch.
| Input | Reason |
|---|---|
| Delivered RT and load factor | Normalize changing service output |
| Chilled-water setpoint | Check equivalent service |
| Condenser-water temperature/flow | Separate lift and heat-transfer effects |
| Unit kW and auxiliary kW | Compare machine and plant boundaries |
| Availability and operating limits | Choose feasible dispatch |
05 · CASE ANALYSIS
Keep program benefits separate
The broader utility program also reported intensity changing from 1.20 to 0.88 kW/RT, approximately 27%. Multiple measures contributed, so it is not assigned to these two tests alone.
Repeat comparisons after maintenance or changing seasons and preserve production/service constraints.
Source-value comparisons
Source figures · English edition
Figures correspond to those published in the Korean case. English titles, axes and legends are provided; published values and evidence boundaries are retained. Open a figure at full size to inspect small labels.
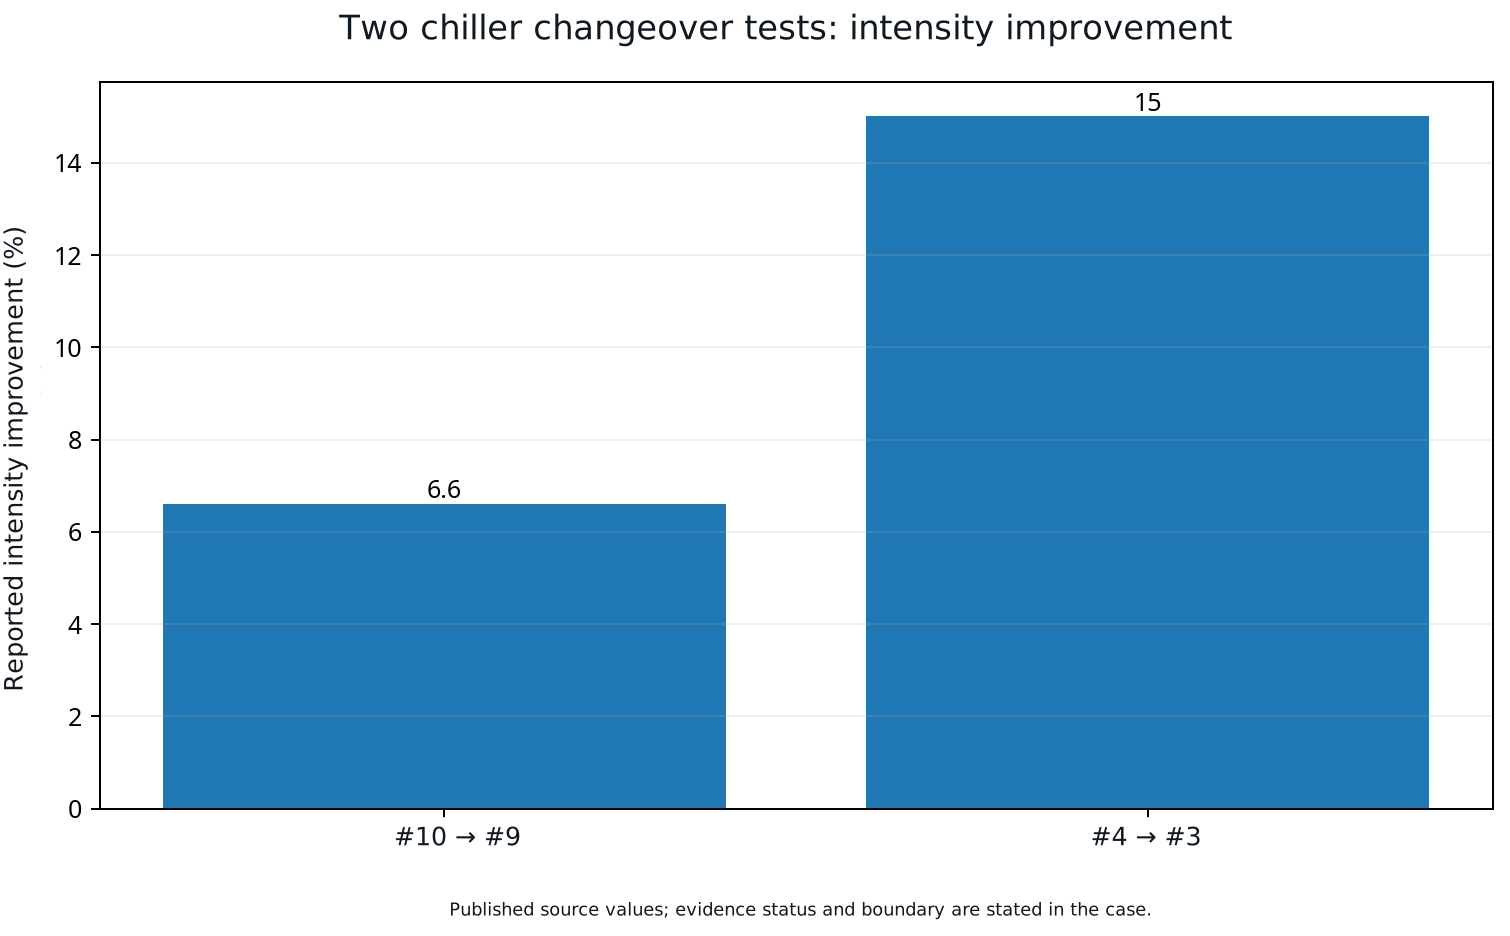
Two separate field tests: #10 → #9, 6.6% intensity improvement; #4 → #3, 15%. They are not combined into one saving.
Open full-size figure ↗APPLY TO YOUR SITE
Connect your operating data to an actionable energy strategy.
Discuss the measurement boundary, data quality, operating constraints and verification approach for your facility.
Discuss your project All English cases