CASE53 · Manufacturing · Chillers
Chilled-water setpoint optimization through Test & Adjust
A manufacturing chiller-system case examines whether raising the chilled-water leaving-temperature setpoint can improve system efficiency while satisfying process, HVAC and dehumidification requirements.
01 · CASE ANALYSIS
Operating question
Producing colder water than the load requires can increase compressor lift. However, chilled-water temperature directly affects process quality, AHU coils, humidity control and dehumidification.
The objective is to find the temperature that minimizes system kW/RT while meeting all service constraints, rather than simply choosing the highest possible water temperature.
02 · CASE ANALYSIS
Field data & measurement boundary
Review chiller status, cooling load, entering/leaving water temperatures, leaving-temperature setpoint, chilled-water flow, condenser-water conditions and chiller/pump power.
The source includes a representative 2,000 USRT rated-capacity example with approximately 17°C entering water, 7°C leaving water, a 7°C setpoint and 630 m³/h flow. Other units show different actual temperature and flow conditions despite similar rated capacity.
Metering checks precede optimization: cooling-load calculation requires measured flow and temperature difference. Whole-plant evaluation also requires pump and cooling-tower fan power.
| Unit / example | Entering chilled water | Leaving chilled water | Flow |
|---|---|---|---|
| Representative example; 7°C setpoint | Approximately 17°C | Approximately 7°C | Approximately 630 m³/h |
| Unit #14 | Approximately 14.8°C | Approximately 7.3°C | Approximately 859 m³/h |
| Unit #08 | Approximately 17°C | Approximately 8.5°C | Approximately 760 m³/h |
03 · CASE ANALYSIS
Stepwise Test & Adjust
Confirm downstream process and AHU/dehumidification requirements and agree on an allowable range. Establish the baseline, adjust the setpoint in small steps, allow the system to stabilize, and collect comparable-load data.
At each step, check supply/return temperatures and ΔT, flow, calculated cooling load, chiller kW/RT, process quality, temperature/humidity and dehumidification. Evaluate system power as well as chiller-only efficiency.
Leaving-water temperature adjustment was managed as an action item alongside condenser-water temperature and efficient-unit loading tests. Isolate each test’s comparison conditions when attributing effects.
04 · CASE ANALYSIS
Performance evaluation
Chiller kW/RT = chiller power (kW) ÷ actual cooling load (RT). A fall in kW alone may reflect a lower cooling load and does not prove efficiency improvement.
System power includes chiller, chilled-water pumps, condenser-water pumps and tower fans. Choose the operating point that meets process, comfort, dehumidification and stability constraints with the lowest system kW/RT.
CASE53 does not publish a quantified savings percentage for this individual setpoint action. No such rate is invented in this English edition.
| Requirement | Evaluation |
|---|---|
| Process quality | Meet the required process-water temperature and interlocks |
| Indoor conditions | Maintain temperature, humidity and dehumidification |
| Operating stability | Assess the settled response after each adjustment |
| Energy performance | Compare at similar load; include pumps and tower fans |
05 · CASE ANALYSIS
Longer-term M&V & future extension
For sustained evaluation, build a baseline using cooling load, condenser-water temperature, outdoor conditions and setpoint where adequate data exist. Separate setpoint effects from load and weather changes.
Seasonal/load-based operating guides may later support dynamic setpoints and predictive control. This is a proposed extension; the documented evidence is field data and Test & Adjust.
Source figures · English edition
Figures correspond to those published in the Korean case. English titles, axes and legends are provided; published values and evidence boundaries are retained. Open a figure at full size to inspect small labels.
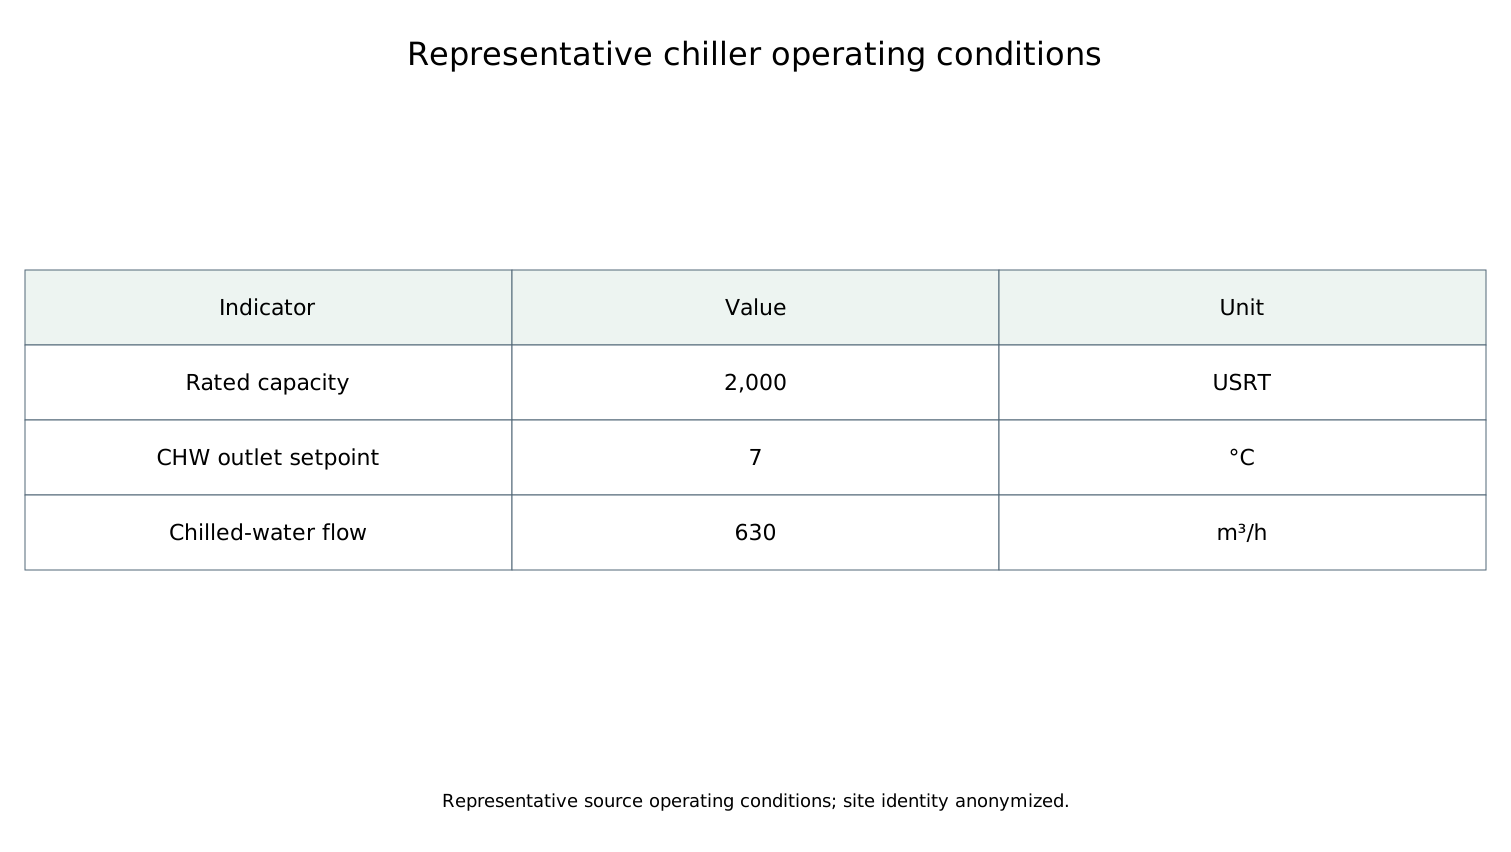
Source representative conditions: 2,000 USRT, 7°C chilled-water outlet setpoint and 630 m³/h. A native English SVG table retains the values.
Open full-size figure ↗APPLY TO YOUR SITE
Connect your operating data to an actionable energy strategy.
Discuss the measurement boundary, data quality, operating constraints and verification approach for your facility.
Discuss your project All English cases