CASE51 · Buildings · eQUEST / historical Appendix G
Constructing a fair Appendix G baseline for a seventy-two-floor LEED energy model
A real design-modeling project compares a mixed-use proposed building with four rotated historical ASHRAE baselines. The cost result is separated from site-energy use and certification claims.
01 · CASE ANALYSIS
Project and modeling scope
The 72-floor building combined office and hotel uses with different schedules: offices five days/week, 07:00–20:00; hotels seven days/week, 24 hours/day.
Gross area was 1,594,260 ft², with 1,192,722 ft² conditioned and 401,538 ft² unconditioned. Proposed glazing ratio was approximately 70%.
02 · CASE ANALYSIS
Build the proposed model and verify inputs
The model included envelope, internal gains, HVAC, process loads, external lighting, parking fans, elevators, tariffs and schedules with hourly TRY weather.
Verification and ES-D, PS-E, BEPS, PS-B and PS-D reports checked input consistency, end uses, cost, peak demand and plant load coverage.
| Rotation | Annual cost (USD million) |
|---|---|
| 0° | 3.715 |
| 90° | 3.703 |
| 180° | 3.710 |
| 270° | 3.757 |
| Reported average | 3.721 |
03 · CASE ANALYSIS
The baseline is rule-defined
The historical baseline used 40% glazing distributed across four orientations, Climate Zone 4A envelope assumptions, office System 7 VAV with hot-water reheat and hotel System 2 PTHP.
Annual runs at 0°, 90°, 180° and 270° were averaged. A baseline is not merely the proposed system with slightly worse equipment efficiency.
04 · CASE ANALYSIS
Cost result and energy-source boundary
The four baseline costs were approximately USD 3.715, 3.703, 3.710 and 3.757 million/year, averaging USD 3.721 million. Proposed cost was approximately USD 3.574 million, about 4% lower.
The related design comparison reports higher proposed site energy, approximately 139,539 versus 102,348 MBtu/year, due to purchased-heat cooling. Lower cost is not lower site energy.
| End use | Proposed | Baseline | Change |
|---|---|---|---|
| Interior lighting | 2,780,571 kWh | 4,638,876 kWh | −40.1% |
| Space heating | 14,338.5 MBtu | 17,725.2 MBtu | −19.1% |
| Interior fans | 3,071,473 kWh | 3,265,508 kWh | −5.9% |
| Electric cooling | 119,837 kWh | 2,285,515 kWh | −94.8% |
05 · CASE ANALYSIS
Engineering interpretation
Calculate percentage improvement as (baseline cost − proposed cost) / baseline cost × 100. Interpret lighting, fans, electric cooling and purchased heat together.
CASE35 describes the related design comparison. This is historical modeling evidence; it is neither a completed operating saving nor a new LEED certification.
Source-value comparisons
Source figures · English edition
Figures correspond to those published in the Korean case. English titles, axes and legends are provided; published values and evidence boundaries are retained. Open a figure at full size to inspect small labels.
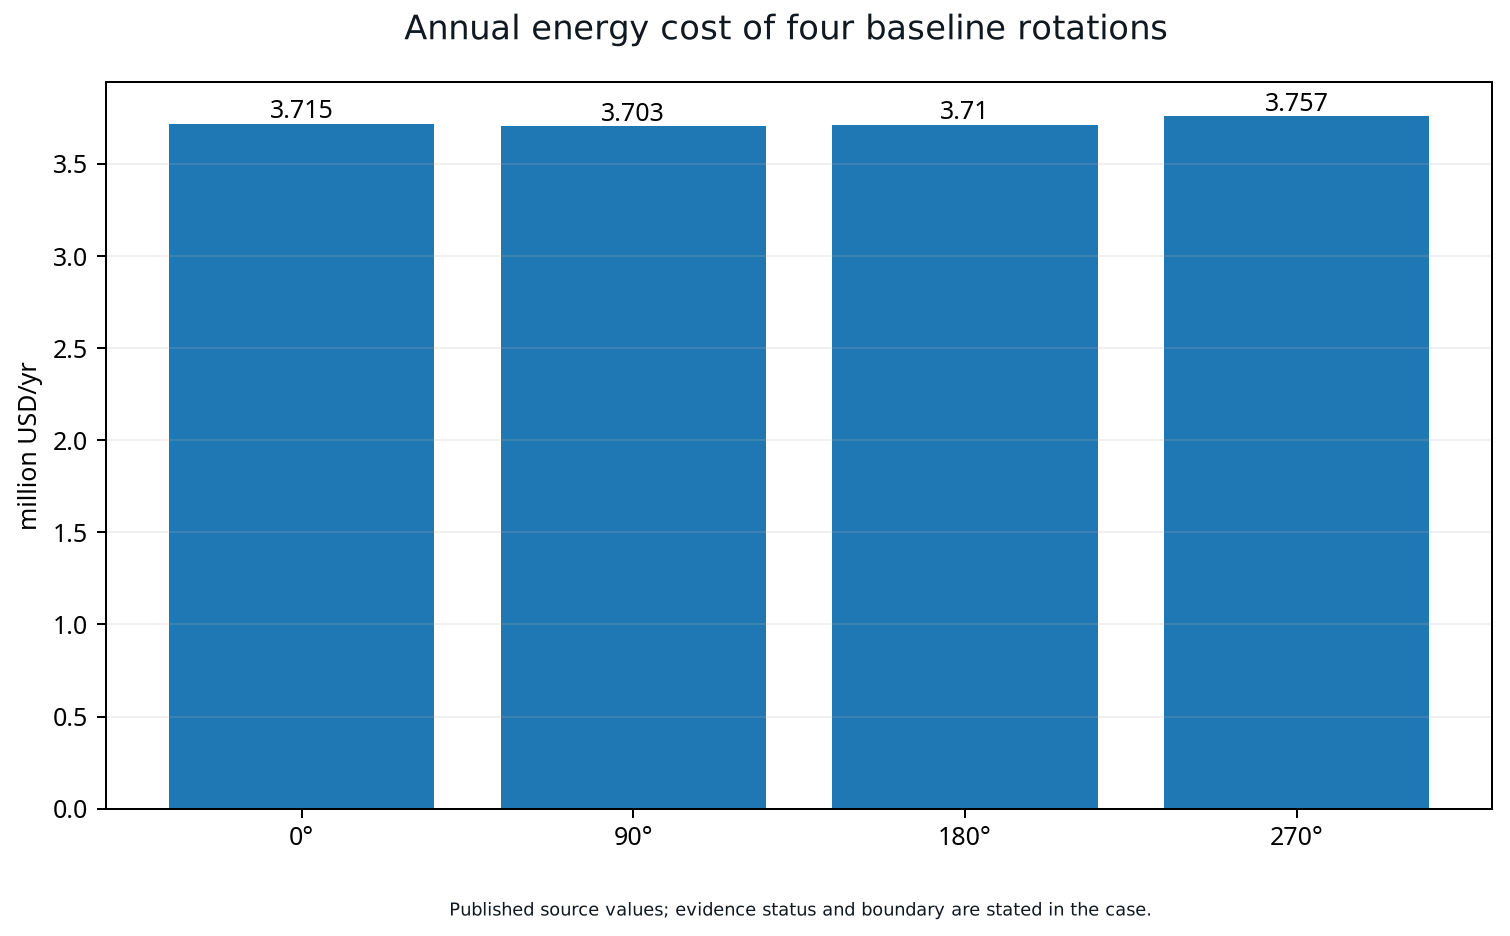
Annual baseline costs at 0°, 90°, 180° and 270°: USD 3.715, 3.703, 3.710 and 3.757 million. Historical simulation, not metered savings.
Open full-size figure ↗APPLY TO YOUR SITE
Connect your operating data to an actionable energy strategy.
Discuss the measurement boundary, data quality, operating constraints and verification approach for your facility.
Discuss your project All English cases