CASE44 · Manufacturing · Multi-site utility benchmarking
Using four-factory utility benchmarks to investigate reproducible operating conditions
Low- and high-temperature chillers and CDA compressors are compared with consistent KPI boundaries. Performance differences guide investigation of load, staging, pumps and bypass control.
01 · CASE ANALYSIS
Benchmarking as a diagnostic question
A factory can improve relative to its own history while still operating above a comparable facility’s energy intensity. Cross-site comparison helps identify achievable operating conditions.
The goal is to explain the best performance, not declare a universal target from the lowest number.
02 · CASE ANALYSIS
Consistent boundaries before ranking
Separate chiller-only UPI from chiller-plus-chilled-water-pump UPI. Align measurement locations, units and periods for CDA power and air volume.
Review chilled-water temperature, equipment type, seasonal load and reserve requirements before assuming that one factory can copy another’s UPI.
| Facility | Chiller UPI | With chilled-water pumps | System load ratio |
|---|---|---|---|
| A | 0.54 | 0.65 | 71.93% |
| B | 0.52 | 0.66 | 69.84% |
| C | 0.40 | 0.50 | 79.54% |
| D | 0.46 | 0.56 | 78.55% |
03 · CASE ANALYSIS
High-temperature systems and bypass
High-temperature chiller-only UPI was approximately 0.37, 0.33, 0.37 and 0.39 for A–D; with chilled-water pumps it was 0.50, 0.44, 0.46 and 0.48.
Average header bypass openings were approximately 43%, 20%, 31% and 33%. Larger openings may reflect minimum-flow or differential-pressure requirements; they are not proof of waste.
04 · CASE ANALYSIS
CDA benchmark and dispatch
CDA UPI ranged from 0.110 to 0.127, with airflow-based load ratios around 80–90%. Compare supply pressure, compressor type, demand and unloading before transferring the best-performing rule.
Use actual versus required-unit counts to investigate parallel low-load operation and dispatch transitions.
| Facility | CDA UPI | Airflow-based load ratio |
|---|---|---|
| A | 0.124 | 90% |
| B | 0.114 | 90% |
| C | 0.127 | 80% |
| D | 0.110 | 89% |
05 · CASE ANALYSIS
From good numbers to operating rules
Trace performance gaps to equipment, load, staging, pump and bypass conditions. Validate which conditions another site can reproduce.
The source reports observed performance patterns. It does not convert the benchmark gaps into achieved annual savings.
Source-value comparisons
Source figures · English edition
Figures correspond to those published in the Korean case. English titles, axes and legends are provided; published values and evidence boundaries are retained. Open a figure at full size to inspect small labels.
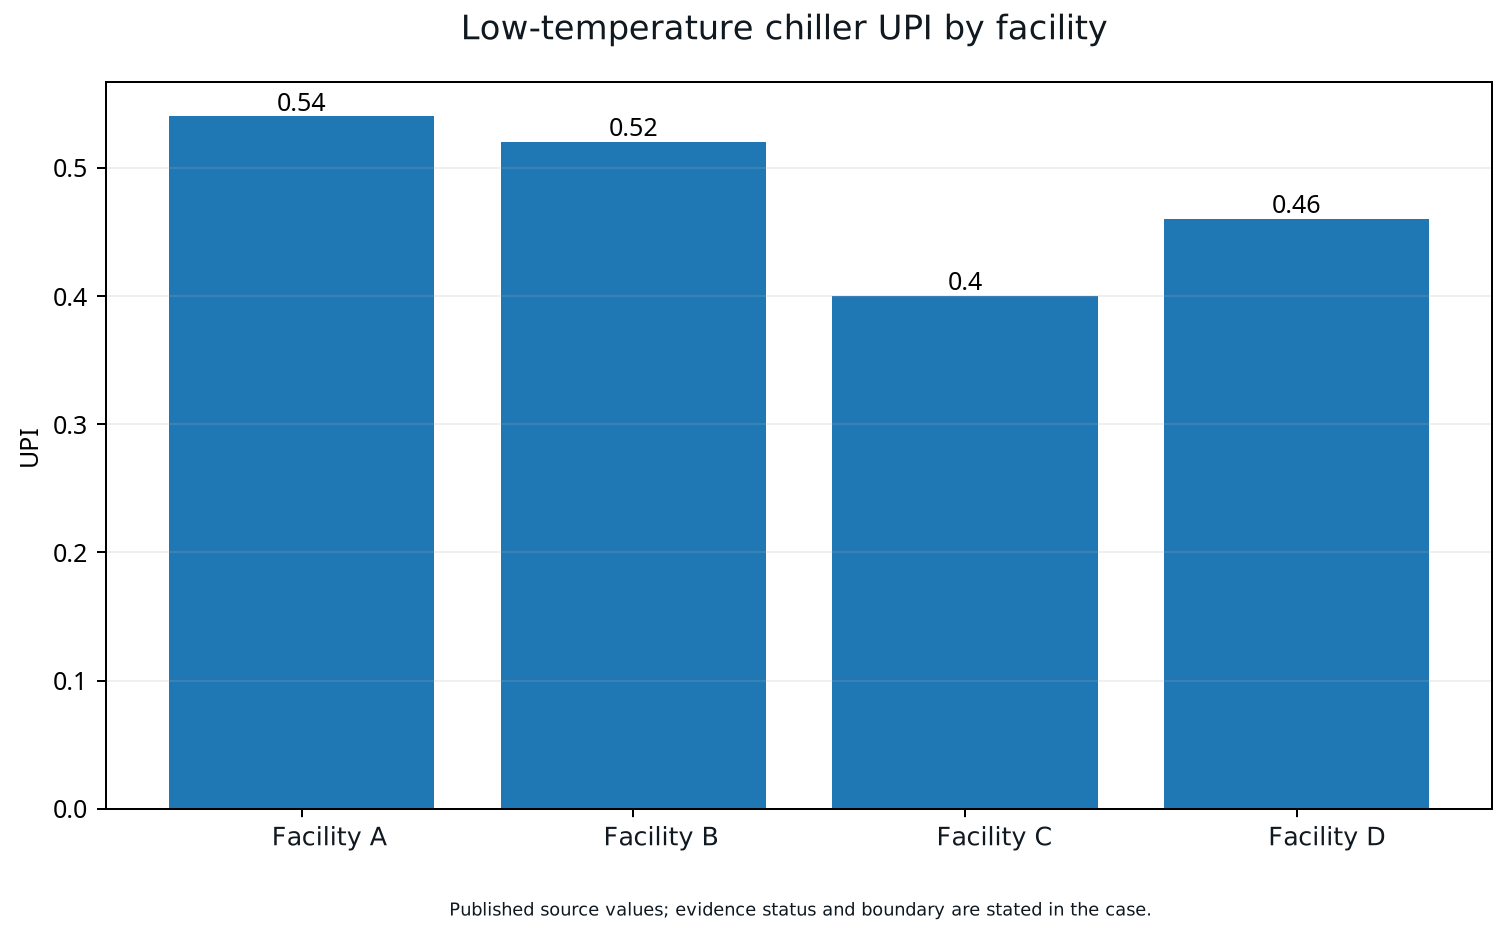
Source low-temperature chiller UPI values: 0.54 / 0.52 / 0.40 / 0.46. Compare measurement boundaries and operating conditions.
Open full-size figure ↗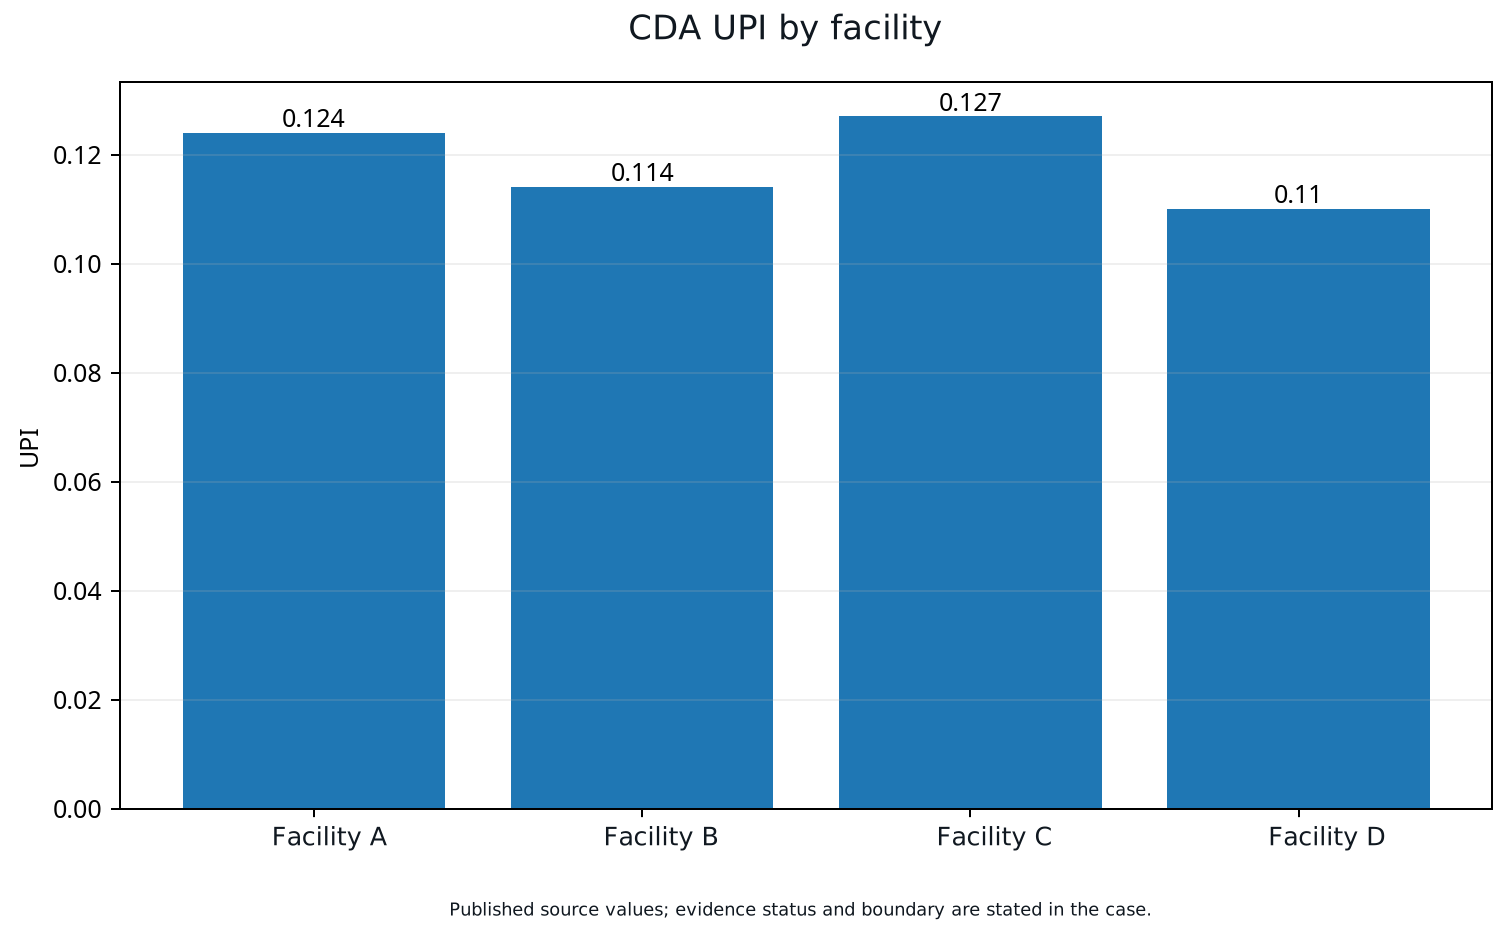
Source CDA UPI values: 0.124 / 0.114 / 0.127 / 0.110. Cross-facility gaps are not implemented savings.
Open full-size figure ↗APPLY TO YOUR SITE
Connect your operating data to an actionable energy strategy.
Discuss the measurement boundary, data quality, operating constraints and verification approach for your facility.
Discuss your project All English cases