CASE43 · Manufacturing · Integrated utility balance
Tracing chiller staging, AHU resistance and compressor losses on one time axis
Chillers, air handling and compressed air are diagnosed as an integrated utility portfolio. Service-specific KPIs and short-interval events reveal operating questions that monthly consumption cannot explain.
01 · CASE ANALYSIS
Integrated rather than isolated diagnosis
For chillers, assess load, power, UPI/COP and water conditions. For AHUs, assess filter differential pressure, outdoor-air dampers and return-air conditions. For compressors, assess flow, pressure, units and loading/unloading.
The objective is to identify whether each utility is matched to actual demand while maintaining production service.
02 · CASE ANALYSIS
Chiller and air-handling observations
Chiller average UPI was 0.84 kWh/RT, COP 4.20 and load ratio 55%. Actual average operating count was 2.1 units versus a load-derived requirement of 1.2.
The 0.9-unit margin is a diagnostic signal requiring reserve, minimum-load and hydraulic review. It is not an immediate instruction to stop one unit. Some AHU filter pressure drops were approximately 19–22 mmAQ versus 12–13 mmAQ elsewhere.
| Utility | Indicator | Observation |
|---|---|---|
| Chillers | Actual / required average units | 2.1 / 1.2 |
| Chillers | UPI / COP / load ratio | 0.84 kWh/RT / 4.20 / 55% |
| AHUs | Filter differential pressure | 19–22 versus 12–13 mmAQ |
| Compressed air | UPI / load ratio | 0.126 kWh/m³ / 81% |
| Compressed air | Mean / maximum instantaneous loss | 3.1% / 31.7% |
03 · CASE ANALYSIS
Compressed-air events
Monthly average compressed-air UPI was 0.126 kWh/m³ and average system load ratio 81%. Average system loss was approximately 3.1%, while a one-minute maximum reached 31.7%.
Investigate the demand, pressure, active-unit and unloading state at the event. Neither a differential-pressure spread nor an instantaneous maximum is an annual saving rate.
04 · CASE ANALYSIS
Proposed utility portfolio
The source annual utility baseline was 10,403,571 kWh, with 444,832 kWh/year potential, approximately 4.3%, and KRW 49,821,132/year expected benefit.
Cooling accounted for the largest potential. Rounded item values sum to 1 kWh more than the reported aggregate, which is preserved as supplied.
| Utility | Baseline kWh/year | Potential kWh/year | Potential rate |
|---|---|---|---|
| AHUs | 1,284,297 | 12,843 | 1.0% |
| Cooling system | 4,575,524 | 320,287 | 7.0% |
| Compressed air | 3,313,220 | 99,397 | 3.0% |
| Other utilities | 1,230,530 | 12,305 | 1.0% |
| Total | 10,403,571 | 444,832 | Approximately 4.3% |
05 · CASE ANALYSIS
Verification and application
Confirm sensor quality and comparable filter grades/airflows before attributing resistance differences to deterioration. Define whether pumps, towers and dryers belong inside each energy boundary.
Verify implemented changes with adjusted cooling load, production, weather, compressed-air demand and operating hours.
Source-value comparisons
Source figures · English edition
Figures correspond to those published in the Korean case. English titles, axes and legends are provided; published values and evidence boundaries are retained. Open a figure at full size to inspect small labels.
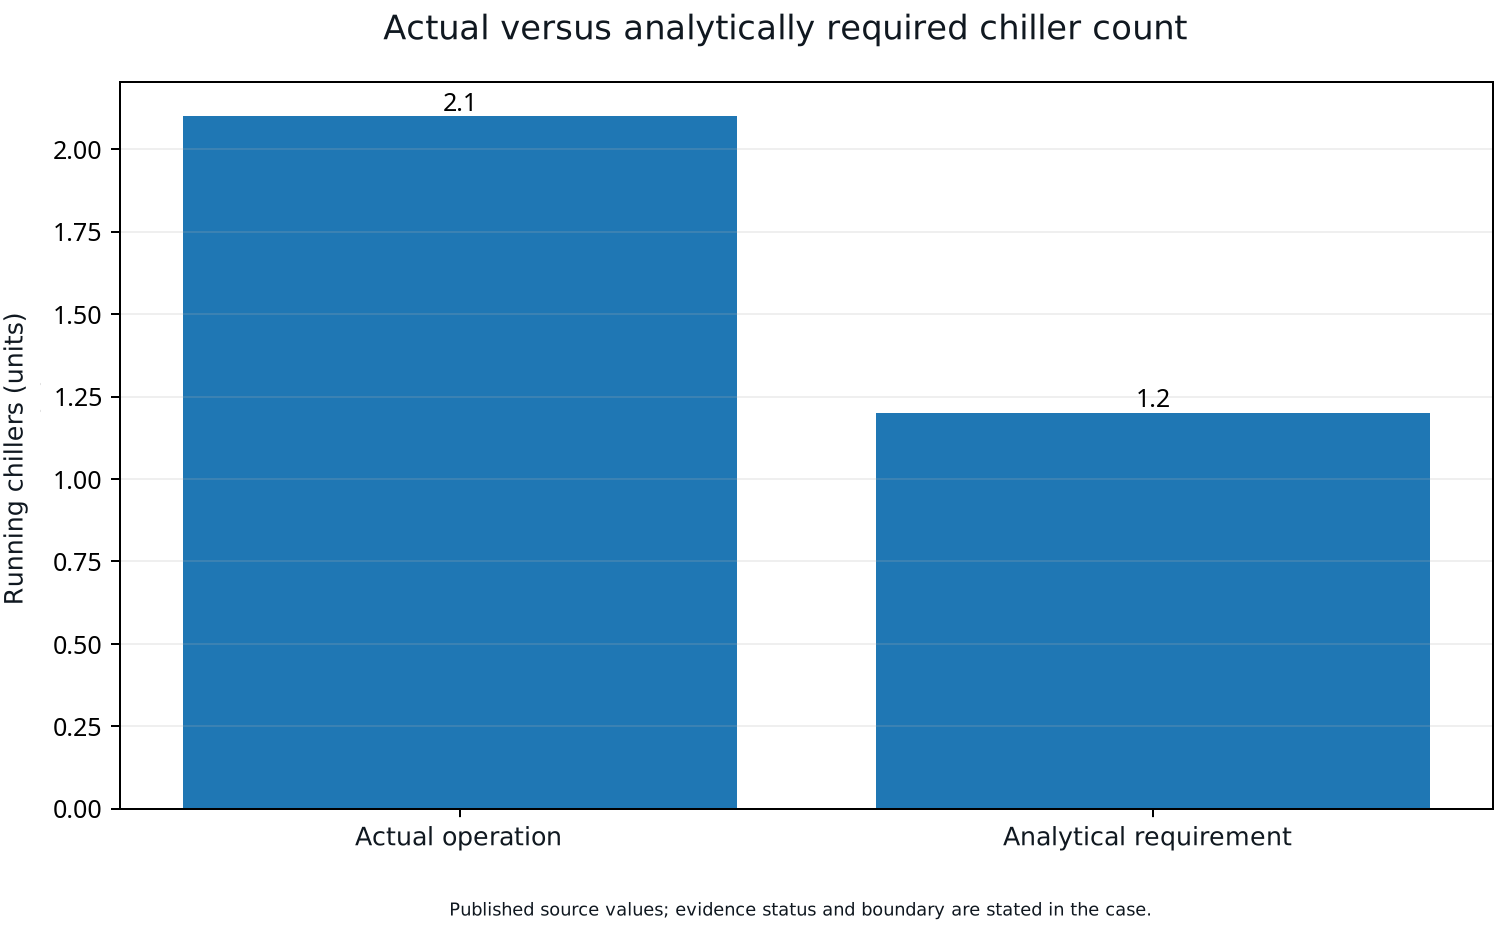
Source average running count 2.1 versus analytical requirement 1.2. The count gap is diagnostic evidence, not an energy-saving percentage.
Open full-size figure ↗APPLY TO YOUR SITE
Connect your operating data to an actionable energy strategy.
Discuss the measurement boundary, data quality, operating constraints and verification approach for your facility.
Discuss your project All English cases