CASE42 · Manufacturing · CDA, chillers and boilers
Building real-time utility-efficiency guidance across semiconductor and display factories
Five-minute utility data link production-service output to energy input, dispatch and active-unit counts. A single-factory program expands to six factories at two production sites.
01 · CASE ANALYSIS
From a single site to a multi-factory program
CDA, chillers and boilers must provide stable pressure, temperature and flow. The project therefore evaluated energy per unit of required utility service rather than reducing energy regardless of service.
The expanded program compared factory databases and five-minute real-time records.
02 · CASE ANALYSIS
Data and operating hypotheses
UPI, load ratio and actual active-unit count support trend, correlation and cross-factory comparisons. Short intervals expose staging transitions that daily averages can conceal.
Measured equipment efficiency and demand determine which machines should run first and how many should operate.
| Indicator | Before | After |
|---|---|---|
| Reported intensity | 0.12897 | 0.12627 |
| Source-printed unit | kW/Nm³ | Definition requires original-data confirmation |
| Relative intensity change | — | Approximately 2.09% |
| Reported annual item benefit | — | KRW 250 million |
03 · CASE ANALYSIS
CDA operating-priority result
The source CDA intensity changed from 0.12897 to 0.12627, approximately 2.09% improvement. The source prints kW/Nm³; the original data definition must be checked before dimensional interpretation.
The CDA priority-operation example is reported at approximately KRW 250 million/year benefit. It is an item within the program, not an extra benefit to add again to the program total.
04 · CASE ANALYSIS
Keep completed and potential benefits separate
Eleven applied optimization items are reported at KRW 1.62 billion/year. Three further candidates are estimated at KRW 350 million/year.
The KRW 1.97 billion/year combined portfolio includes both evidence types and must not be labeled wholly verified field savings.
| Portfolio component | Annual benefit | Evidence |
|---|---|---|
| Eleven applied items | KRW 1.62 billion | Reported implementation result |
| Three additional candidates | KRW 350 million | Additional potential |
| Combined portfolio | KRW 1.97 billion | Result plus potential |
05 · CASE ANALYSIS
Transferable engineering lesson
Define utility-service output, metering boundaries, common auxiliaries and operating constraints before comparing factories. Confirm whether an efficient dispatch rule can be reproduced under comparable demand.
Maintain service pressure, temperature and production quality while documenting the implemented rule and its savings boundary.
Source-value comparisons
Source figures · English edition
Figures correspond to those published in the Korean case. English titles, axes and legends are provided; published values and evidence boundaries are retained. Open a figure at full size to inspect small labels.
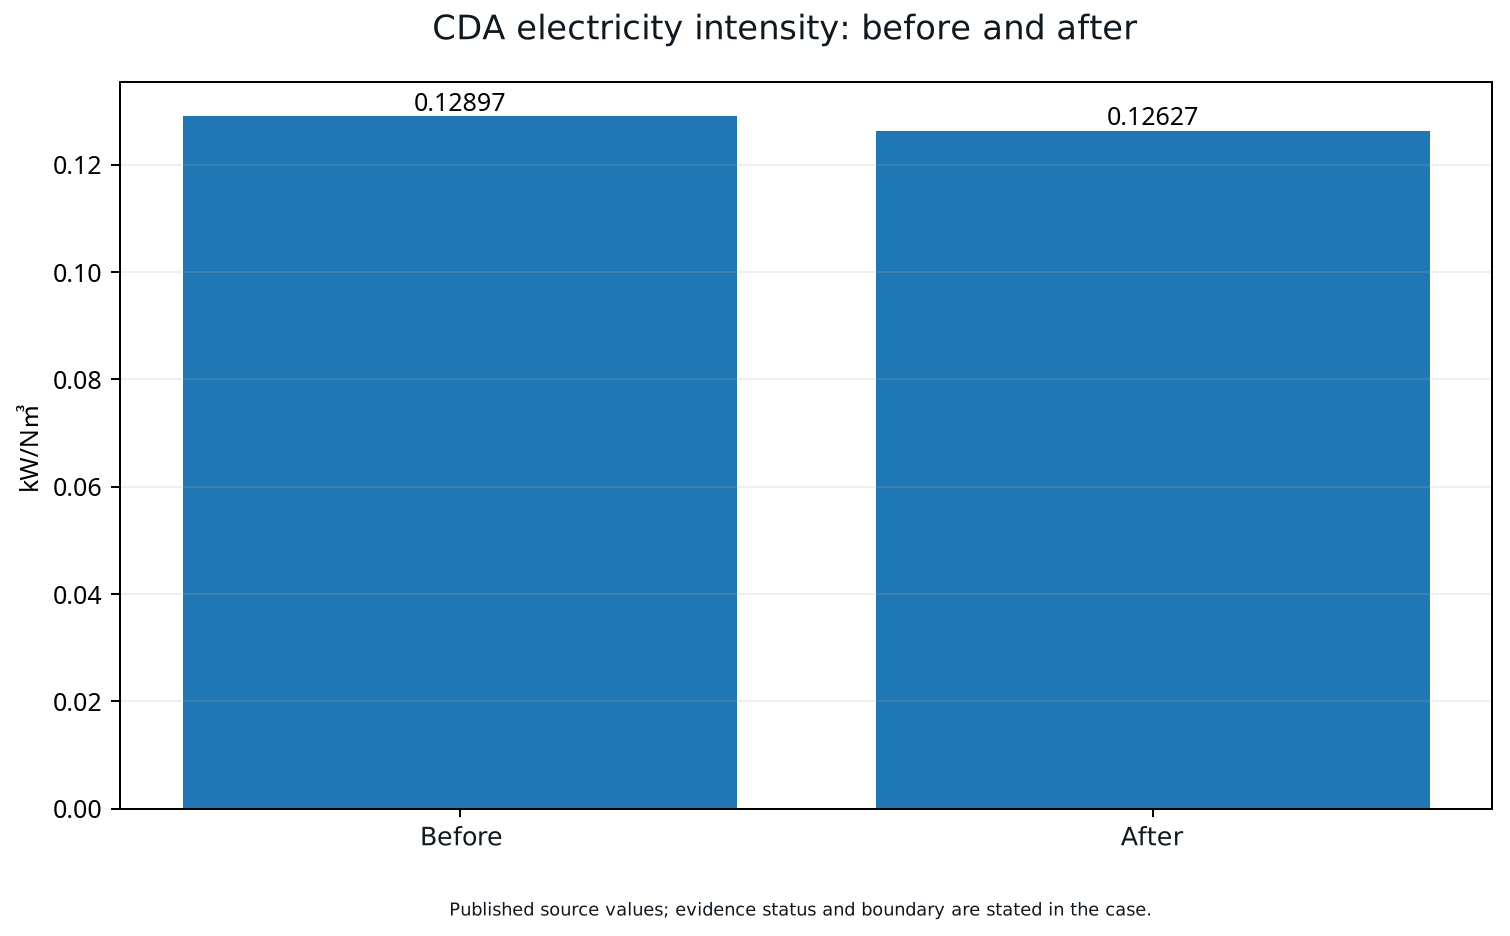
Reported before/after values: 0.12897 and 0.12627. The source-axis notation kW/Nm³ is retained; read the operating-flow and measurement definition in the case before reusing this unit.
Open full-size figure ↗APPLY TO YOUR SITE
Connect your operating data to an actionable energy strategy.
Discuss the measurement boundary, data quality, operating constraints and verification approach for your facility.
Discuss your project All English cases