CASE37 · Renewable energy · MATLAB solar-resource analysis
Comparing solar installation conditions with hourly irradiance modeling
Weather data and solar geometry construct horizontal and tilted-surface radiation over 8,760 hours. Tilt, azimuth and available surfaces are compared before downstream PV generation and economic modeling.
01 · CASE ANALYSIS
Resource before equipment sizing
The analysis begins with site-specific weather and irradiance, including multiple Korean regions, rather than assuming that panel capacity alone determines output.
Latitude, longitude, standard meridian, declination, hour angle, zenith angle and surface incidence determine the hourly geometric relationship.
02 · CASE ANALYSIS
Tilted-surface radiation model
The source combines beam, diffuse and ground-reflected components: IT = Ib × Rb × η + Id × (1 + cosβ)/2 × η + IH × ρg × (1 − cosβ)/2 × η.
Here β is tilt and ρg ground reflectance. The source coefficient η is a calculation factor; it must not be reinterpreted as a complete PV module/inverter/system loss model.
| Symbol | Meaning |
|---|---|
| Ib × Rb | Beam component projected onto the installation plane |
| Id × (1 + cosβ)/2 | Diffuse component |
| IH × ρg × (1 − cosβ)/2 | Ground-reflected component |
| η | Source calculation factor; not a complete PV loss model |
03 · CASE ANALYSIS
Hourly-to-annual aggregation
Aggregate hourly results to daily, monthly and annual radiation. Compare installation candidates by annual resource, not just the largest instantaneous value.
The MATLAB sweep evaluates tilts from 0° to 90° in 5° steps, alongside azimuth and roof/wall installation surfaces.
04 · CASE ANALYSIS
Engineering constraints and scope
Annual radiation maximum is not necessarily the complete installation optimum. Roof geometry, shading, structure, wind loading, maintenance and module packing also matter.
PV capacity, generation, self-consumption, tariffs and payback require separate downstream models. The source does not quantify achieved PV generation or project savings.
| Resolution | Design use |
|---|---|
| Hourly | Available solar hours and intraday profile |
| Daily | Day-to-day variability |
| Monthly | Seasonal resource and downstream model input |
| Annual | Tilt, azimuth and feasible-surface comparison |
05 · CASE ANALYSIS
Transferable workflow
Select site/weather; compute solar geometry; separate irradiance components; apply surface tilt/azimuth; aggregate results; compare feasible installation conditions.
Keep input provenance and resource units explicit when passing the results to a PV performance model.
Source figures · English edition
Figures correspond to those published in the Korean case. English titles, axes and legends are provided; published values and evidence boundaries are retained. Open a figure at full size to inspect small labels.
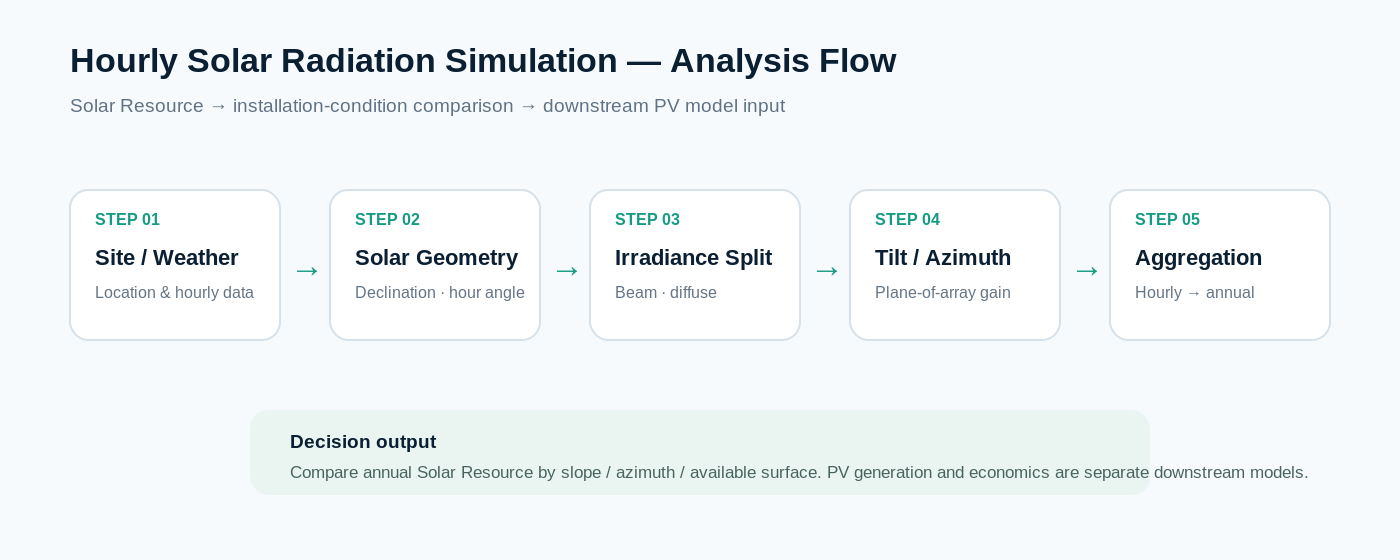
Site/weather, solar geometry, irradiance components, tilt/azimuth and aggregation. This is a workflow diagram, not a measured saving.
Open full-size figure ↗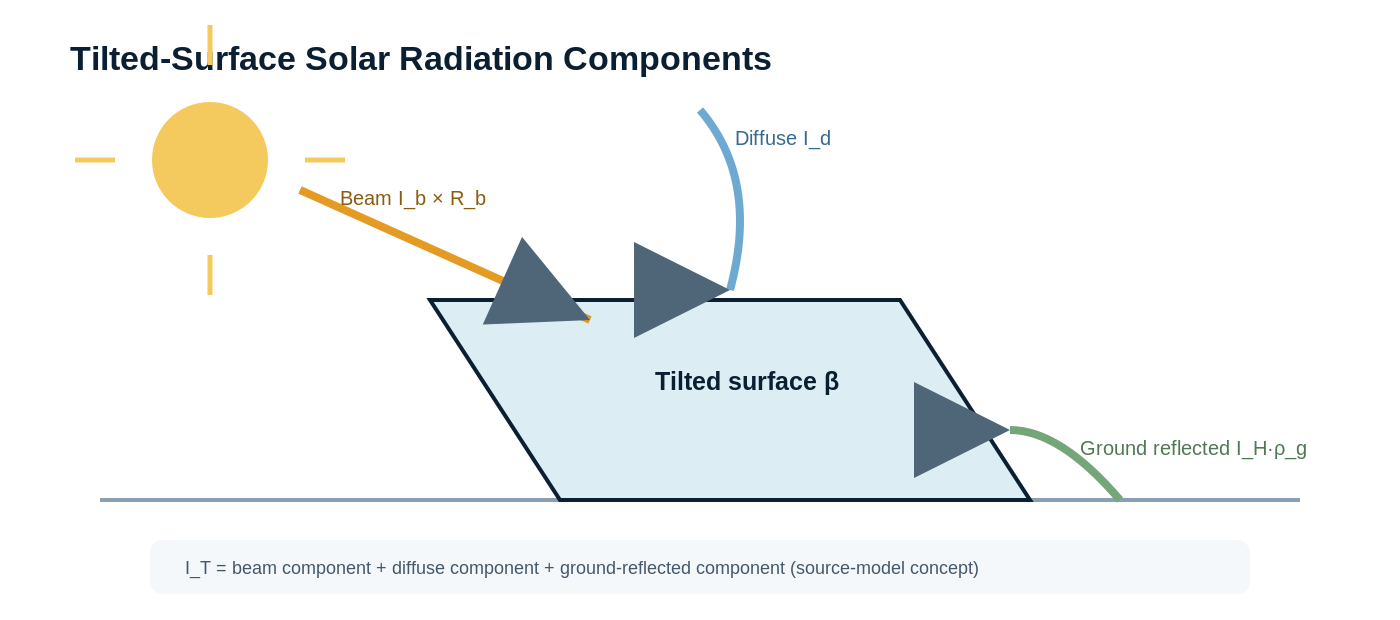
Beam, diffuse and ground-reflected components at the tilted surface. Concept diagram from the source.
Open full-size figure ↗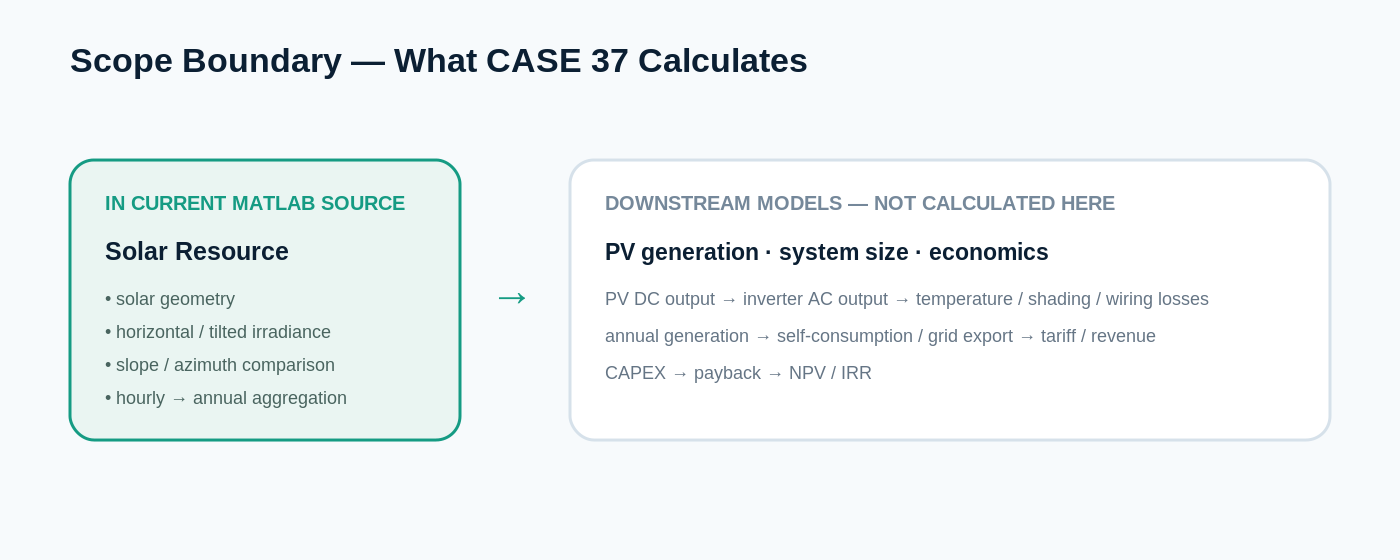
The source computes solar resource. PV output, installed capacity and investment economics require separate downstream models.
Open full-size figure ↗APPLY TO YOUR SITE
Connect your operating data to an actionable energy strategy.
Discuss the measurement boundary, data quality, operating constraints and verification approach for your facility.
Discuss your project All English cases