CASE32 · Buildings · 15-minute electricity analytics
Revealing building load structure from 35,136 fifteen-minute measurements
A twelve-month metered series is reorganized by month, day type and hour to investigate night loads, winter HVAC and peak-demand priorities. Estimated end uses remain distinct from measured whole-building electricity.
01 · CASE ANALYSIS
Why interval data matter
Monthly bills cannot identify which hours contain persistent night loads, holiday operation, early HVAC starts or peak events. Each day was reconstructed as a 96-point load profile.
The source describes the period as one year. It spans 366 calendar days because February 2024 is a leap month; 366 × 96 agrees with the reported 35,136 points.
02 · CASE ANALYSIS
Six-step analysis
Check interval data quality; build daily profiles; classify Monday, other weekdays, Saturday and holidays; analyze representative hourly patterns; estimate base, lighting/plug and HVAC components; rank operating opportunities.
Annual energy, average demand and maximum demand come from the actual whole-building meter. End-use segregation is a pattern-based estimate, not submetering.
| Indicator | Result |
|---|---|
| Interval points | 35,136 at 15-minute intervals |
| Electricity | 2,655.8 MWh |
| Average demand | 302.3 kW |
| Maximum demand | 768.2 kW; 9 January 2024, 10:30 |
| 97.5th percentile | 525.6 kW |
03 · CASE ANALYSIS
Measured operating patterns
Average demand was 302.3 kW. Maximum demand reached 768.2 kW at 10:30 on 9 January 2024; the annual 97.5th percentile was 525.6 kW.
January electricity was approximately 340.6 MWh, while June and September were each approximately 149.6 MWh. Weekday mean demand was around 273 kW during 00:00–05:00 and 319 kW during 09:00–17:00.
04 · CASE ANALYSIS
Estimated load structure and priorities
Estimated annual shares were 61.3% base load, 35.8% HVAC and 2.9% lighting/plug loads. These are analytical allocations with uncertainty, not independently measured end uses.
Review essential versus avoidable night loads, winter HVAC start/stop and setpoints, and sequential starting or demand control during the highest-load intervals.
| Indicator | Estimate |
|---|---|
| Annual base-load share | 61.3% |
| Annual HVAC share | 35.8% |
| Annual lighting/plug share | 2.9% |
| HVAC share: January / December / February | 57.4% / 52.6% / 53.0% |
| HVAC share: June / September | 8.5% / 7.8% |
05 · CASE ANALYSIS
Interpretation and M&V
High night load is not automatically waste in a continuously operated facility. Confirm building use, occupancy and required service before changing schedules.
Verify implemented measures using adjusted baselines and actual HVAC/operating records. The diagnosis does not report an achieved savings percentage.
Source figures · English edition
Figures correspond to those published in the Korean case. English titles, axes and legends are provided; published values and evidence boundaries are retained. Open a figure at full size to inspect small labels.
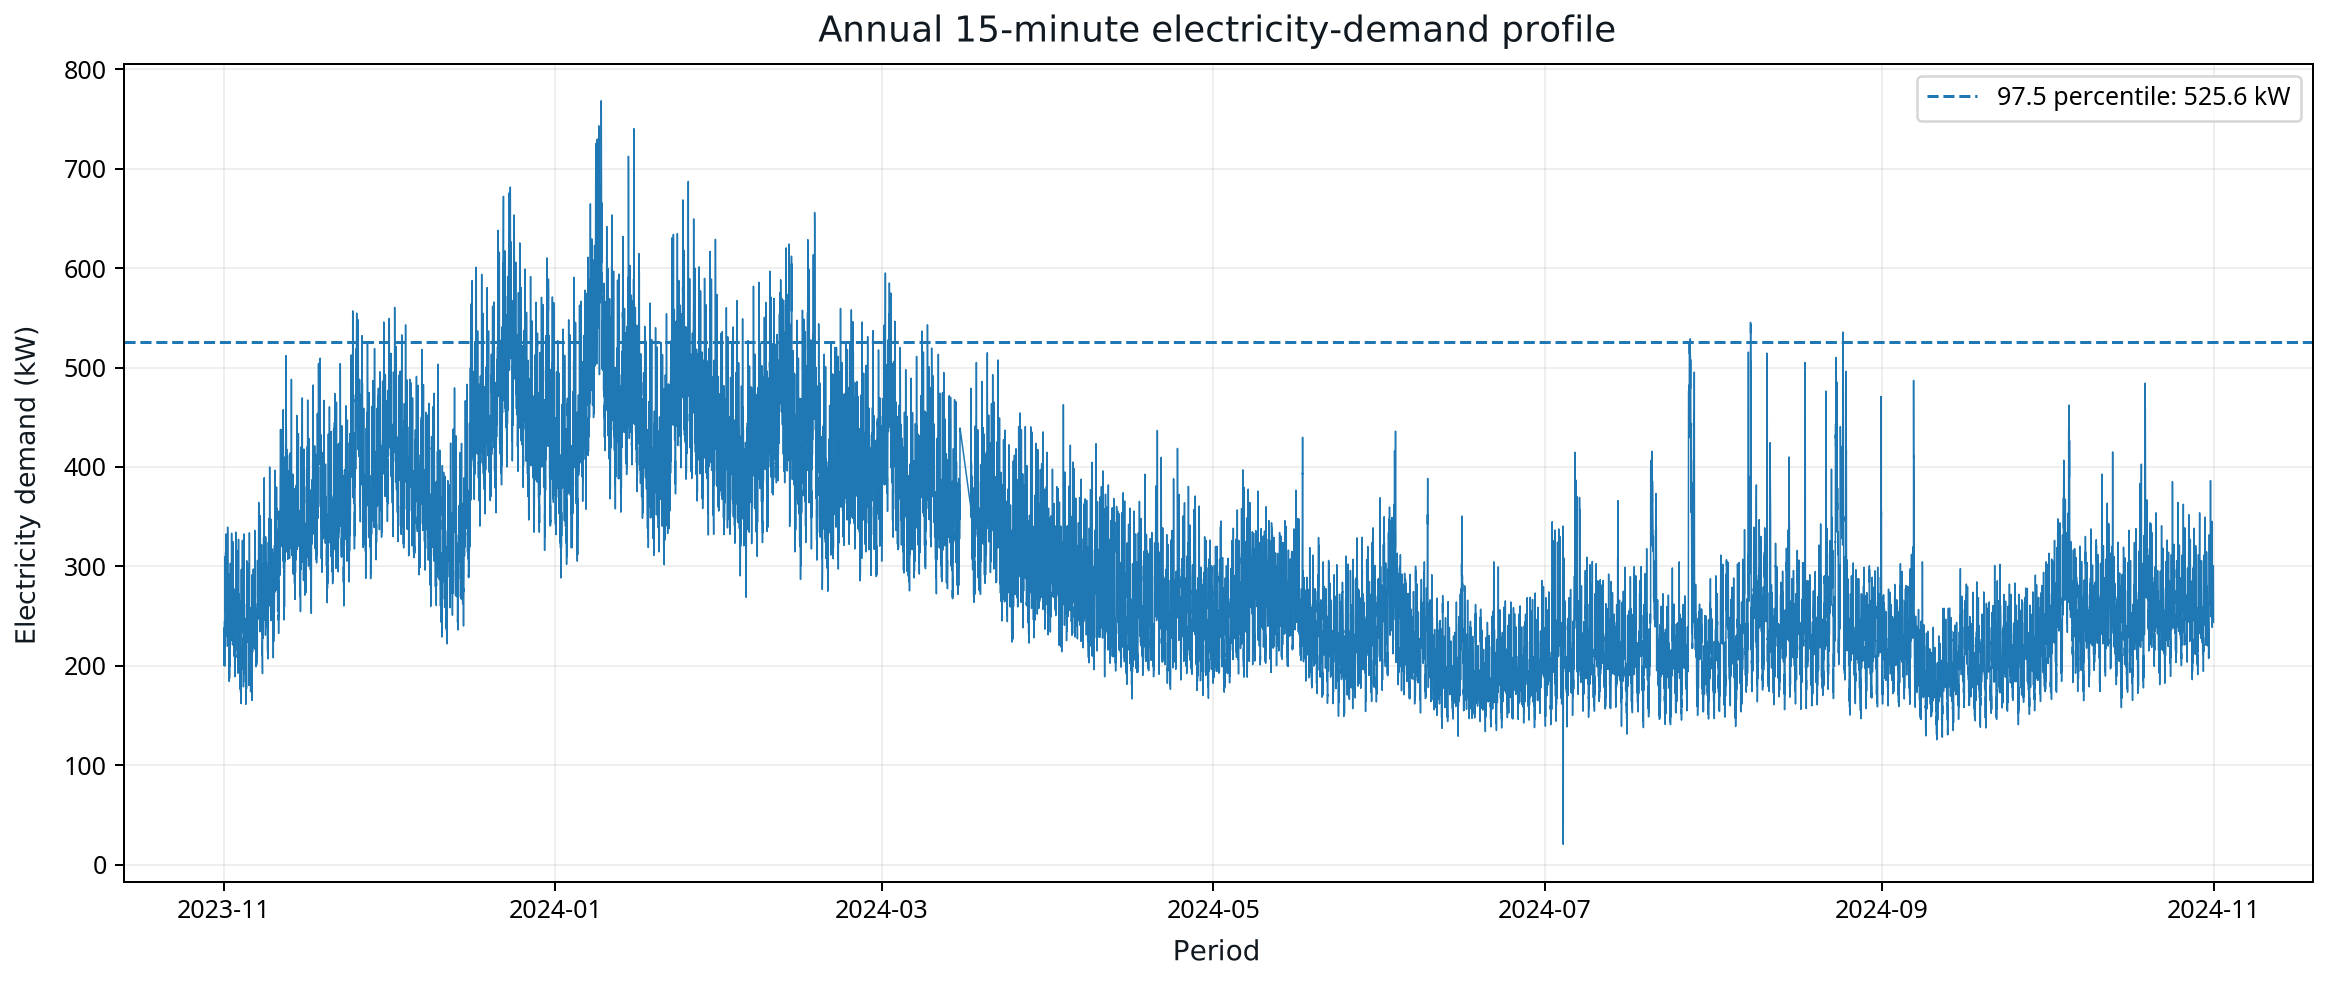
Original annual 15-minute demand series. The dashed 97.5th-percentile threshold is 525.6 kW; it is not a contract-demand setting.
Open full-size figure ↗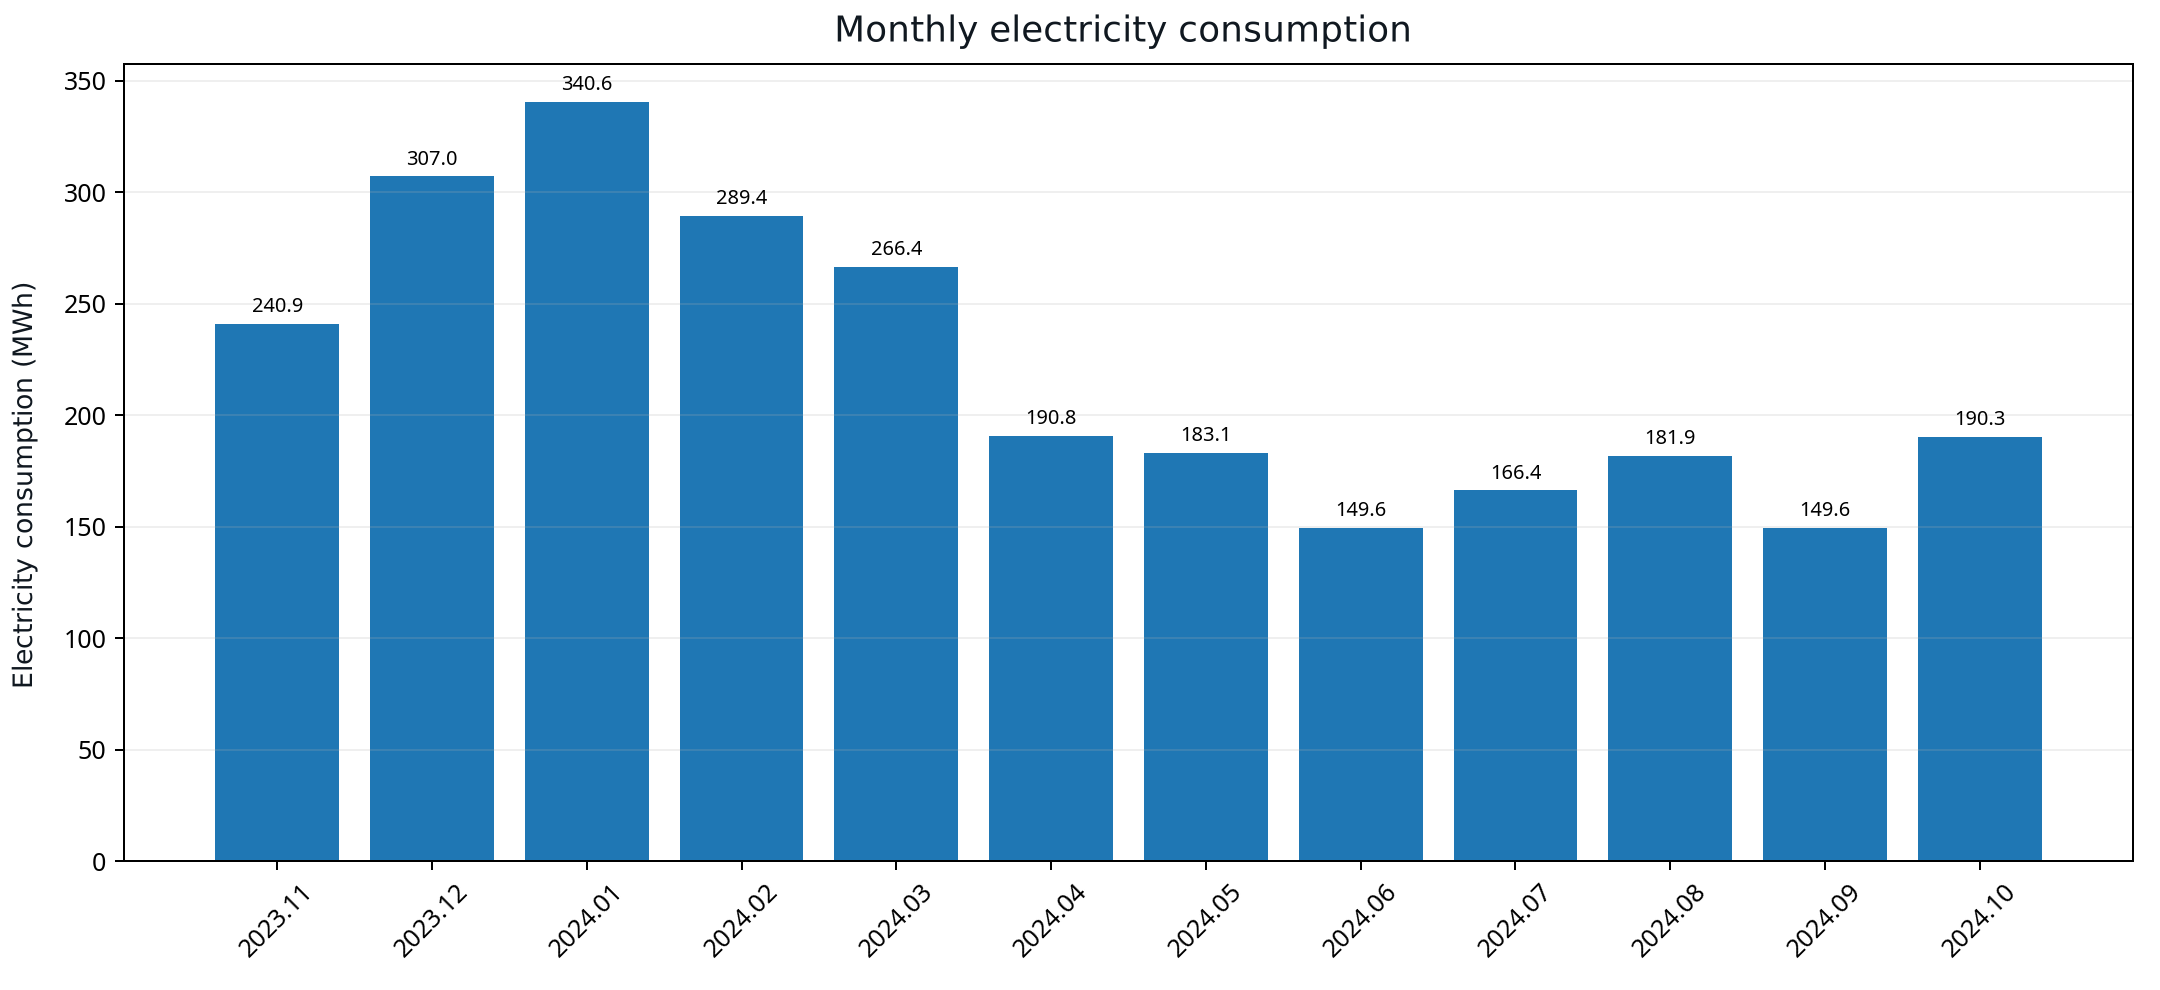
Published monthly electricity totals. The data marks and numeric values are retained.
Open full-size figure ↗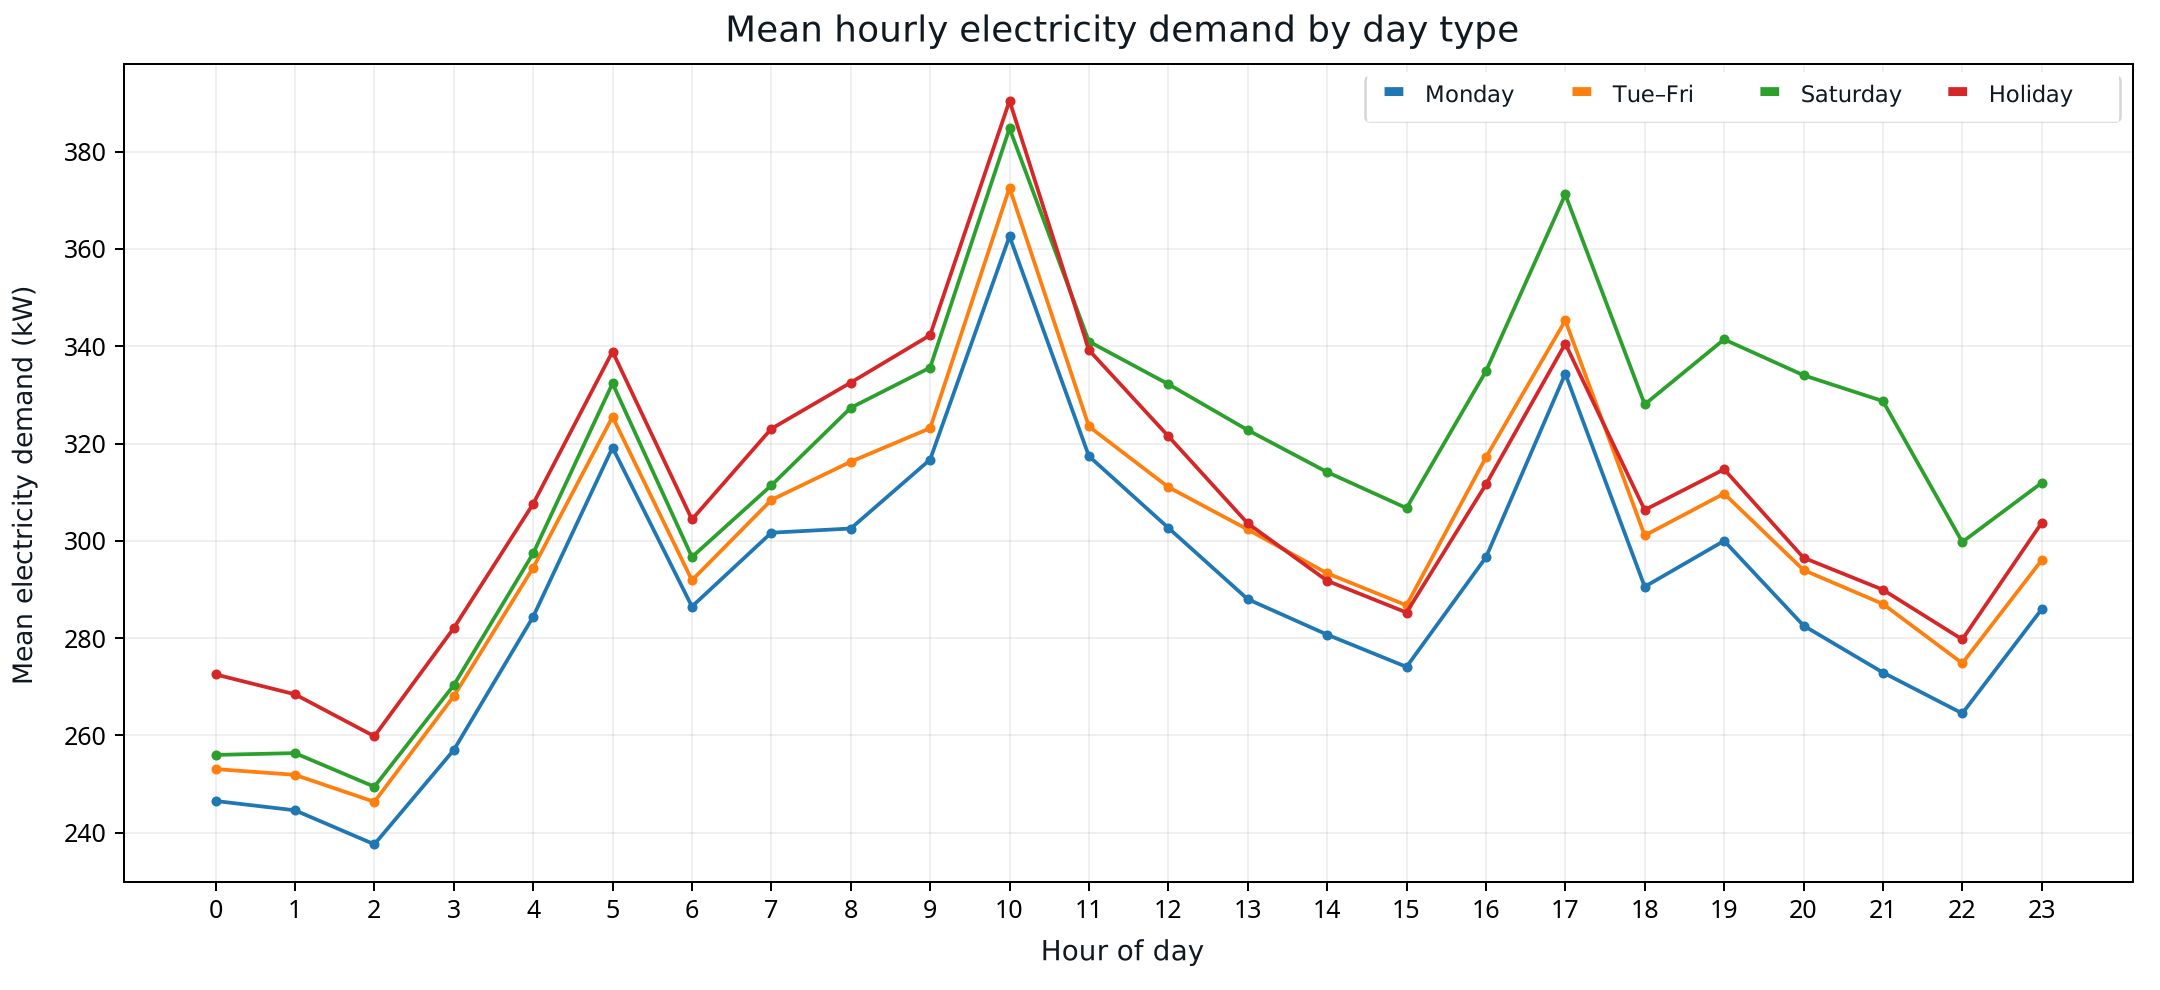
Mean hourly profiles by day type. Blue: Monday; orange: Tuesday–Friday; green: Saturday; red: holiday.
Open full-size figure ↗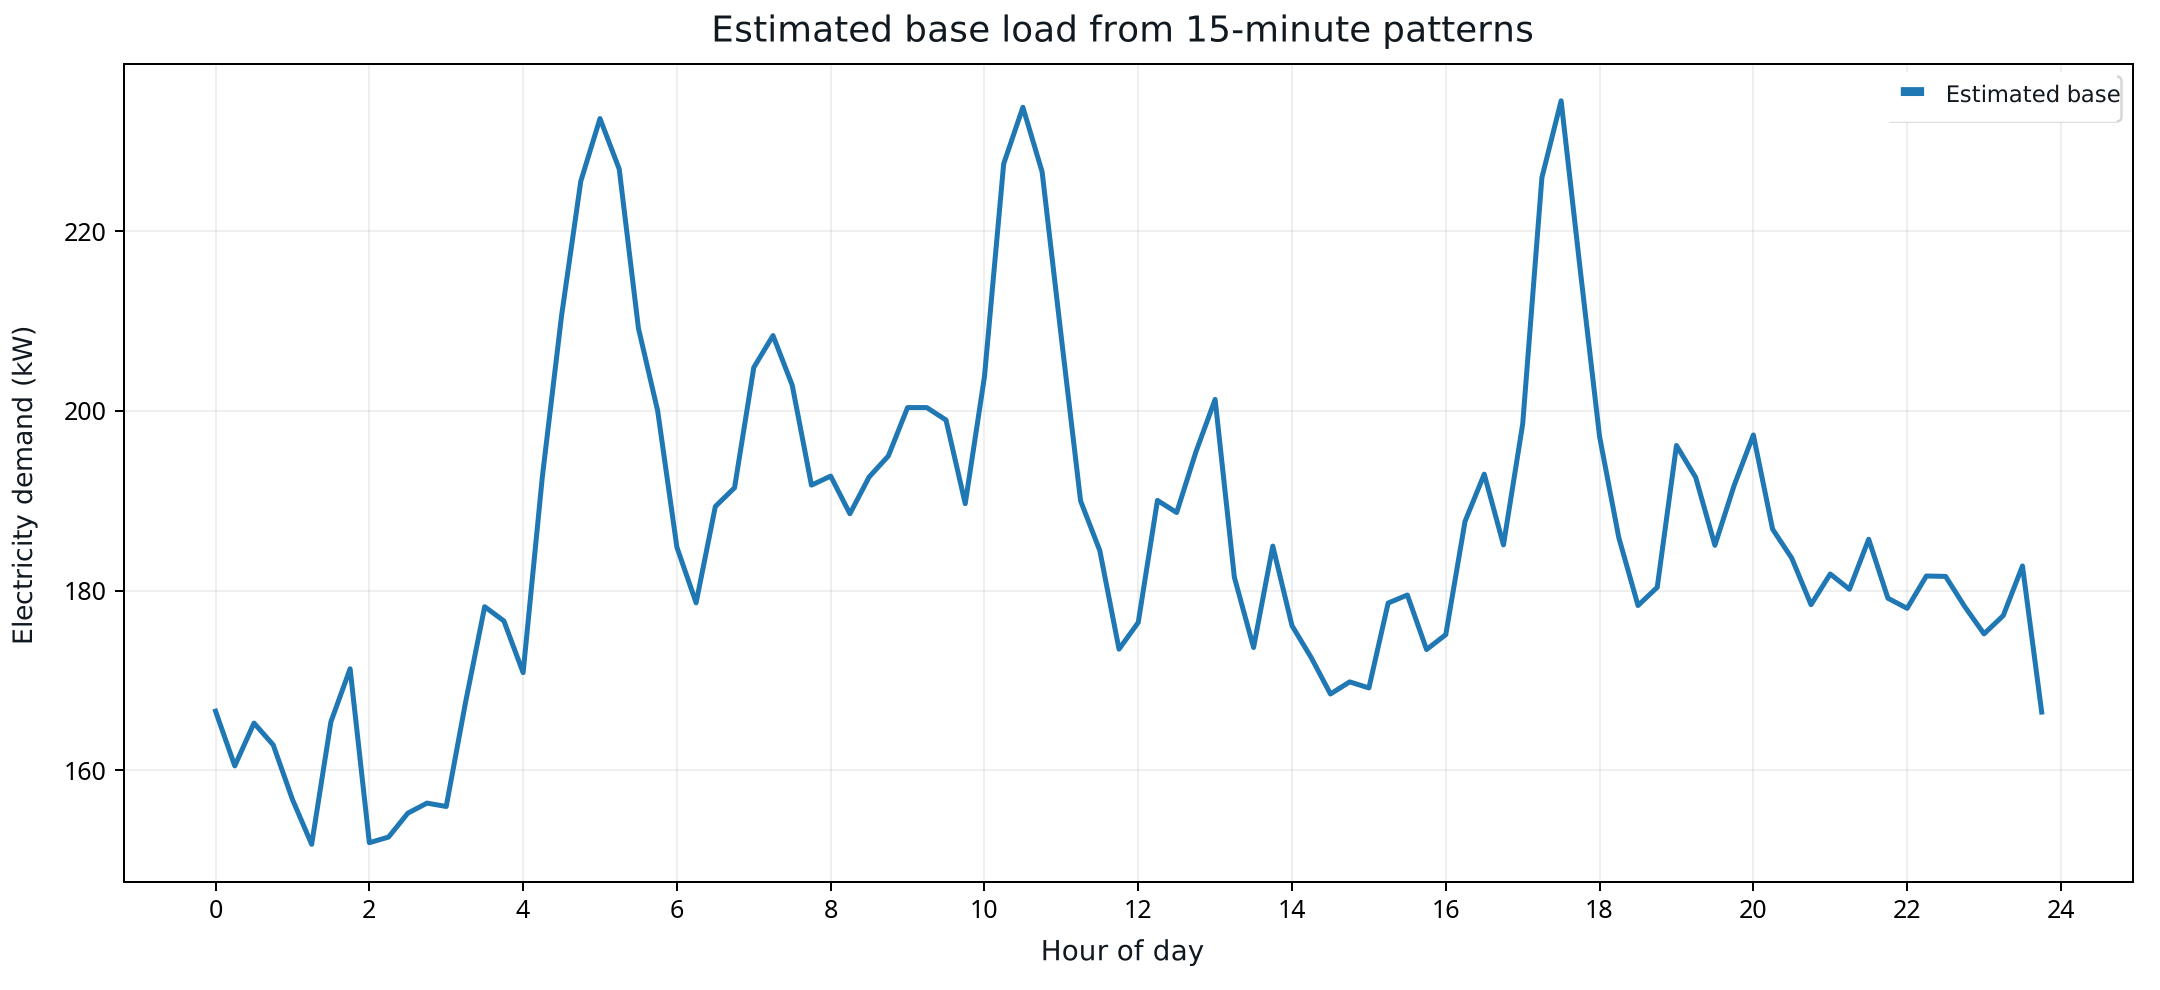
Pattern-based base-load estimate. This estimated profile is not a measured end-use submeter.
Open full-size figure ↗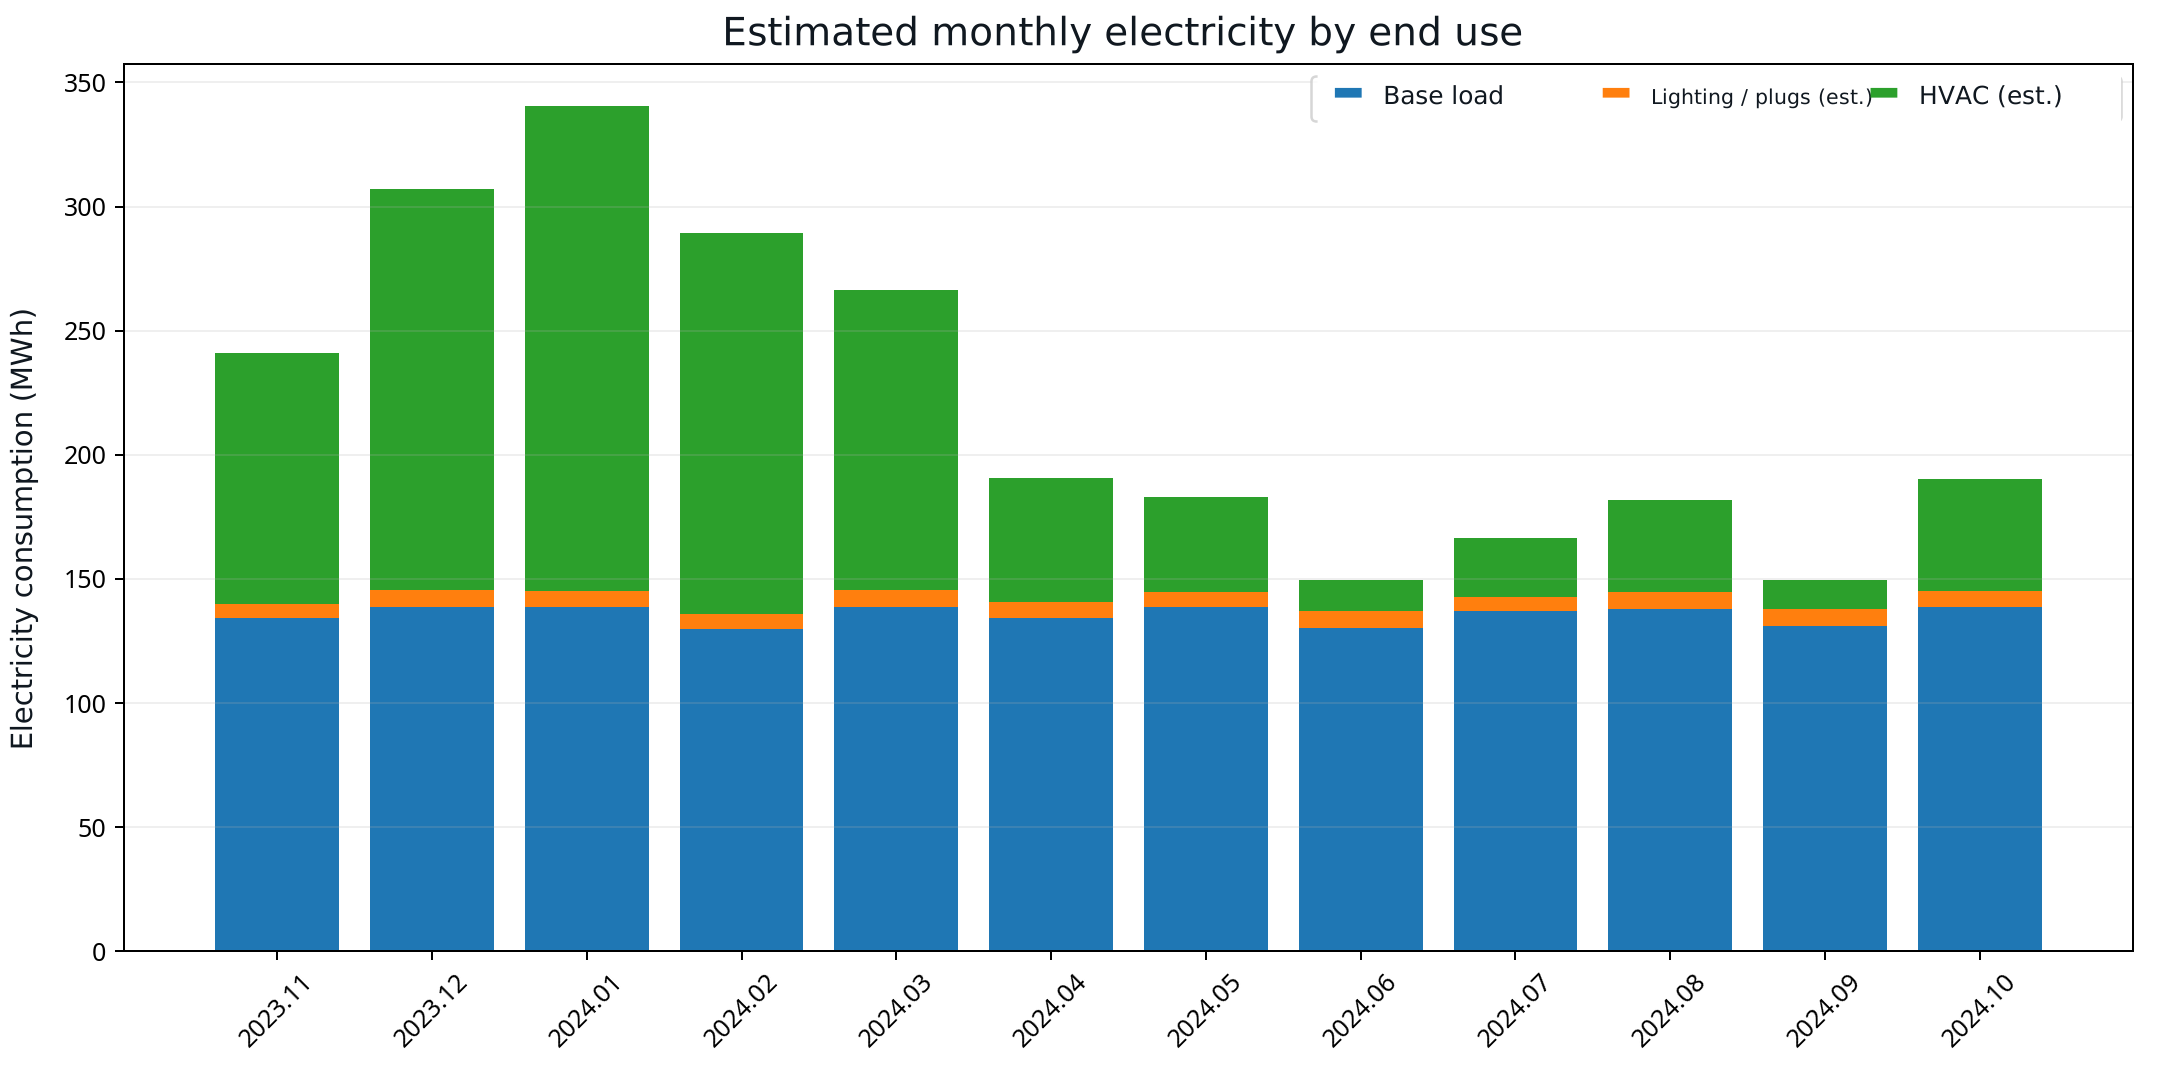
Estimated end-use decomposition. Base load, lighting/plug estimate and HVAC estimate are model allocations, not individually metered end uses.
Open full-size figure ↗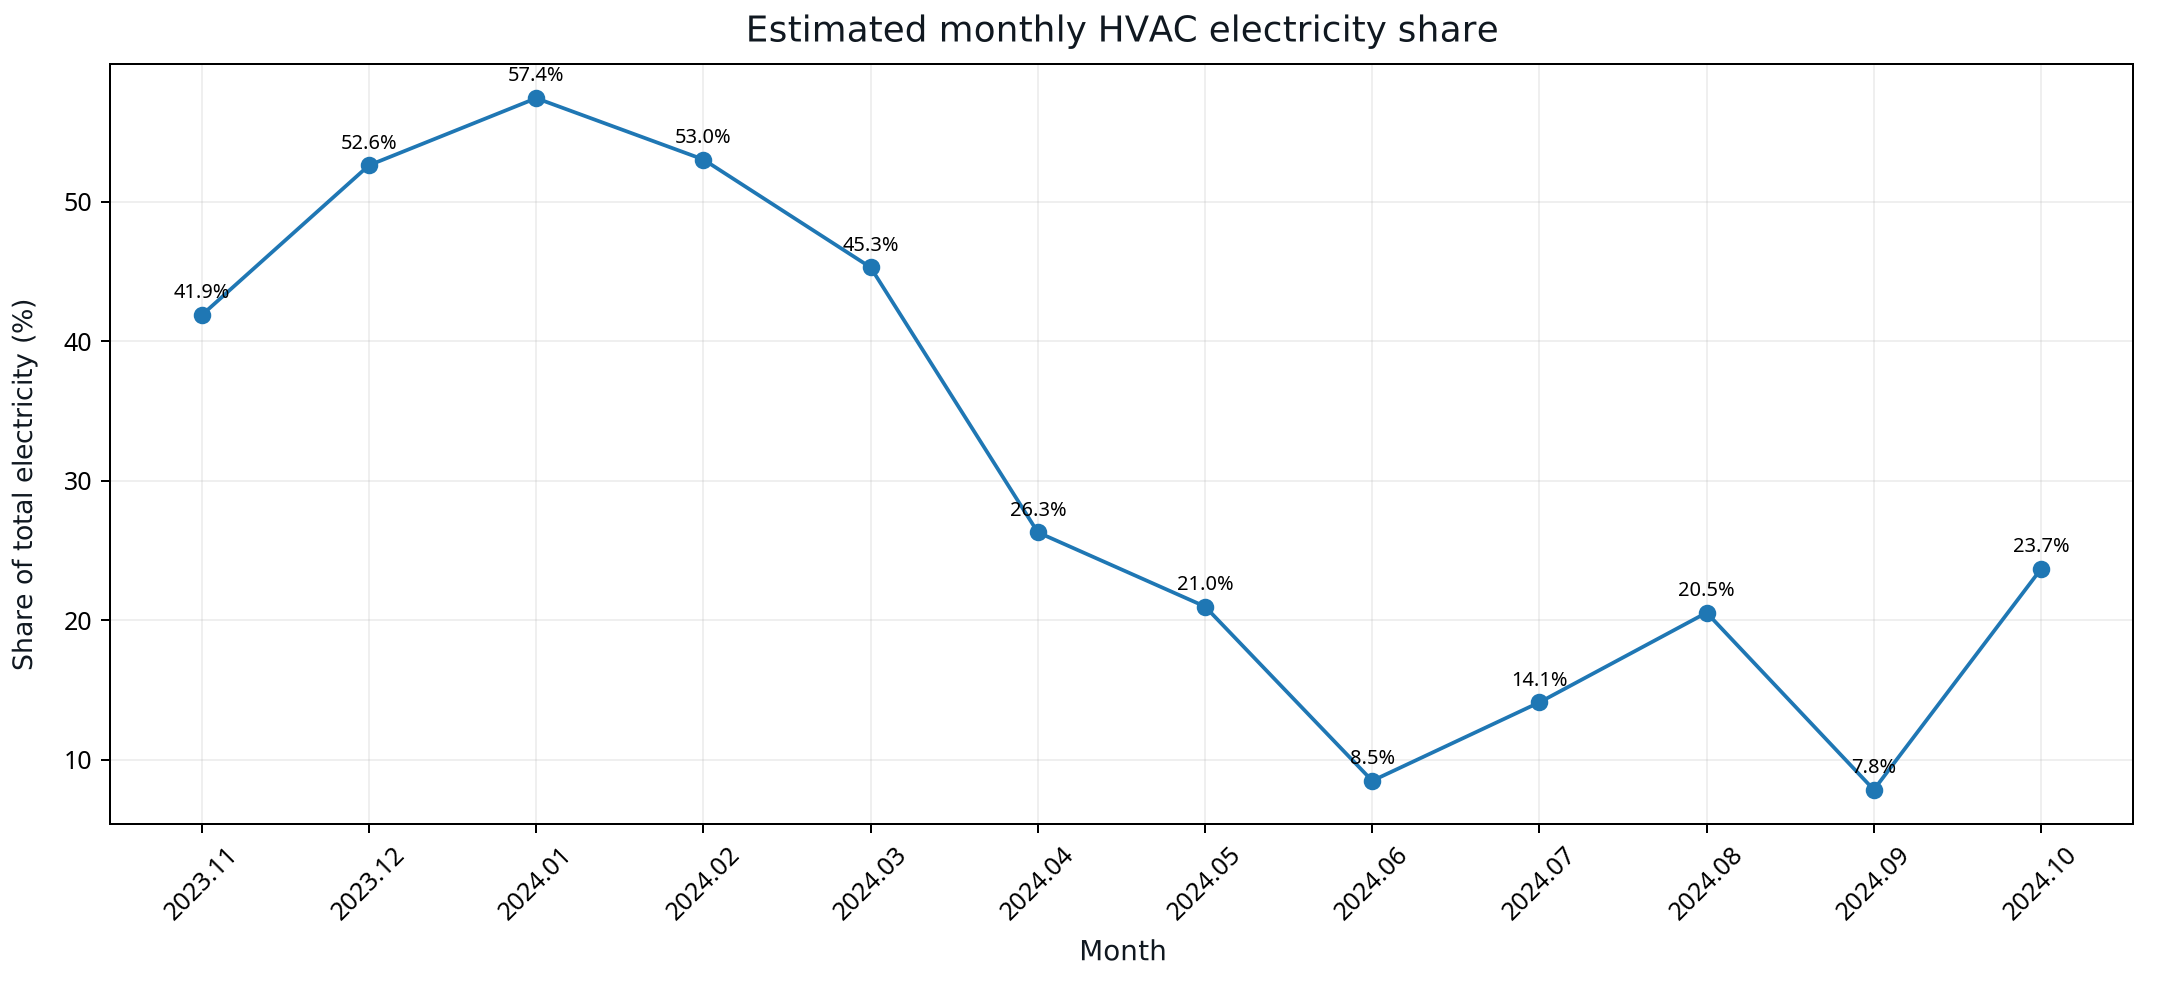
Estimated monthly HVAC share of total electricity. January 57.4%, February 53.0% and December 52.6% are source values.
Open full-size figure ↗APPLY TO YOUR SITE
Connect your operating data to an actionable energy strategy.
Discuss the measurement boundary, data quality, operating constraints and verification approach for your facility.
Discuss your project All English cases